Module
Exploring Soils
From the Noongar
...“The most powerful stuff happens when Noongar people return to their sacred lands, when they are given the authority to re-enliven country through cultural practise. Our first action was to remove livestock and machinery and [to reintroduce] natural elements starting with the plants. We reintroduced trees, native grasses and groundcovers all species that are endemic to the landscape. Our management practises are [driven by the idea that] we need to strengthen country with biodiversity. If we have the right species of plants, we’ll attract a variety of insects. The insects will attract the birds, and then we’ll also attract foragers - the little critters that scratch around, doing all the really good stuff with the soil. One of our sacred foragers is the echidna the nyingarn. We’ve got a really healthy nyingarn population on our property now, that absolutely was not there before. We also have a really huge diversity of birds, and we’ve seen the soil improve - it’s softened…”
From Oral McGuire, Ballardong Noongar leader and land manager.
www.landscapeaustralia.com/articles/cultivating-connections-oral-mcguire

Background
The rock underlying a greater part of Western Australia is ancient. It dates from the time of Gondwana, some billions of years ago, when the southern continents were joined in a single large land mass. The rock is mostly granite, overlaid with ancient sandplains that formed some 25 to 57 million years ago [2]. The sandplains consist mostly of two types of soil particle:
Sand is a mixture of rounded particles of rock, about 0.05 to 2 mm in diameter, composed mainly of silicon dioxide.
• This compound has a molecular structure that makes it dense and hard (just like graphite and diamonds), and contains iron impurities, which give sand a yellow colour.
• Although sand supports very few plant life forms in comparison with other soil types, sand is a valuable component of a soil mixture. The large size and the roundness of sand particles allows for more air, and water, to pass between the particles.
• This improves the drainage in tight soils (such as clay), providing water to penetrate the root zone and support plant-growth.
Clay - has soil particles, smaller than 0.002 mm in size. The particles are thin, flat, and covered with tiny plates that tend to stick together.
• Clay consists mainly of aluminium silicate, in the form of negatively charged particles that attract positively charged plant nutrients – such as potassium, calcium, magnesium and certain forms of nitrogen. All are valuable nutrients for plants.
• The colour of clay can be brown, red, orange, or grey, depending on the ions that bind to the particles.
For more information see:
https://www.resources.wheatbeltnrm.org.au/knowledge-hub/a-simple-guide-for-describing-soils
and

Sand Particles (x4 magnification)
Diagram showing relative size of soil particles In: https://www.uen.org/lessonplan/view/33048
Water-Holding Capacity
The water-holding capacity of soils depends on the size and shape of the particles.
• Because sand particles are one or two orders of magnitude larger than those of clay, the surface area of sand particles, (compared with that of clay), is much smaller, thereby reducing the ability of sand particles to adsorb water molecules to their surface, called ‘adhesion’.
• Although permeable to water, their small surface area (relative to their size) allows much of the water to pass through, and travel downwards in the soil.
• In contrast, the comparatively large surface area of clay particles (compared to their volume) allows for a larger volume of water to be held between and within the particles.
• Clay particles hold water by absorption. Because the clay particles are flat and stick together, the spaces between them are small enough for water molecules to stick together (or cohere), holding the water between the particles. This allows very little water movement through the soil. It is clay that forms the base of farm dams, and the impenetrable layers in an aquifer.
Thus, the water holding capacity of sand is almost negligible, and that of clay is almost total.
For healthy plant growth, the optimal soil texture is a mixture of clay, silt, and sand particles, called loam.

Diagram showing difference between absorption (water in spaces around particles) and adsorption (water held on surface of particle, or held between particles). Water, and clay particles
Activity
Measure Soil Moisture Content in Relation to Soil Particle Size:
Students compare soils from two different origins: Sample A - soil from a composted garden plot is compared with Sample B - soil from a firebreak, nearby bush, or working farmland soil.
Safety
• When handling soil, always wear safety glasses.
• Do not ingest or smell the soil, and avoid inhaling its dust. Harmful bacteria and fungi could be present.
• Wash your hands thoroughly with soap and water afterwards.
HOW TO COLLECT SAMPLES
METHOD
The methods outlined below are modified from Years 1-6, Introduction to Soil Science. https://www.uwa.edu.au/study/for-teachers/science-resources-for-teachers
1. Standard methods of soil sampling involve the use of a hand-held augur or a PVC 5cm ring. If not available, students may use a garden trowel.
2. Collect a sample of 10-12 cm deep of topsoil. Place in a self-seal plastic bag, and label place of origin.
3. For testing moisture content, salinity, and temperature, scrape off the surface layers of leaf matter and twigs, and collect from the top 10 cm of earth.
4. For investigating micro and macroinvertebrate content, samples should include the surface litter layer. Litter is a collection of decaying leaves, twigs, petals, and bark, and is the habitat of much of the microfauna.
5. When comparing 2 sites, the volume of soil collected should be comparable, establishing equivalence for the parameters to be measured ‘fairly’.
MATERIALS
• 2 soil samples. Collect about 100g per student, as described above. Soil A from the schoolyard may be compared with soil B from an enriched garden plot, or from a farm dam, rich in clay.
• 2 ovenproof dishes + lids
• Balance
• Oven
• Calculator
• Microscope, with X200 magnification
• Glass slides
• WORKSHEET 1, Soil Moisture, acidity & salinity Content (TOOLBOX)
METHODS
Calculating water content
1. Weigh an ovenproof dish with its lid. Record the mass (W1) in the respective column in your record sheet (Worksheet 1).
2. Place soil sample (A) into the dish.
3. Reweigh the dish, with soil sample, and the lid. Record mass (W2) and add to the record sheet.
4. W2 – W1 = weight of wet soil …………………………….. (WW)
5. Repeat the steps with soil sample B.
6. Place the dishes (with lids off) into an oven (105oC) until dry (about 2 hours).
7. Remove from the oven, replace the lids, and allow the samples to cool.
8. Reweigh the cooled dish (plus lid) (W3), and add to the record sheet.
9. W3 – W1 = weight of dry soil ……………………………… (WD).
10. Calculate the water mass…………………………………….(WW) – (WD) = (WM)
11. Express water volume as a percentage ……………(WM) / (WW) x 100
Estimating particle size
1. Using clean forceps, transfer a small, well-mixed sample (ca 100mg) from dried soil A onto a glass slide.
2. Sand particles will be easy to see under low power (x10); draw, and estimate size, taking into account the degree of magnification.
3. Repeat (i), examining a small, well-mixed sample from dried soil B.
4. Magnification may be as high as X200 before clay particles will be visible.
5. Draw, and estimate size, taking into account the degree of magnification.
6. Compare the 2 samples.
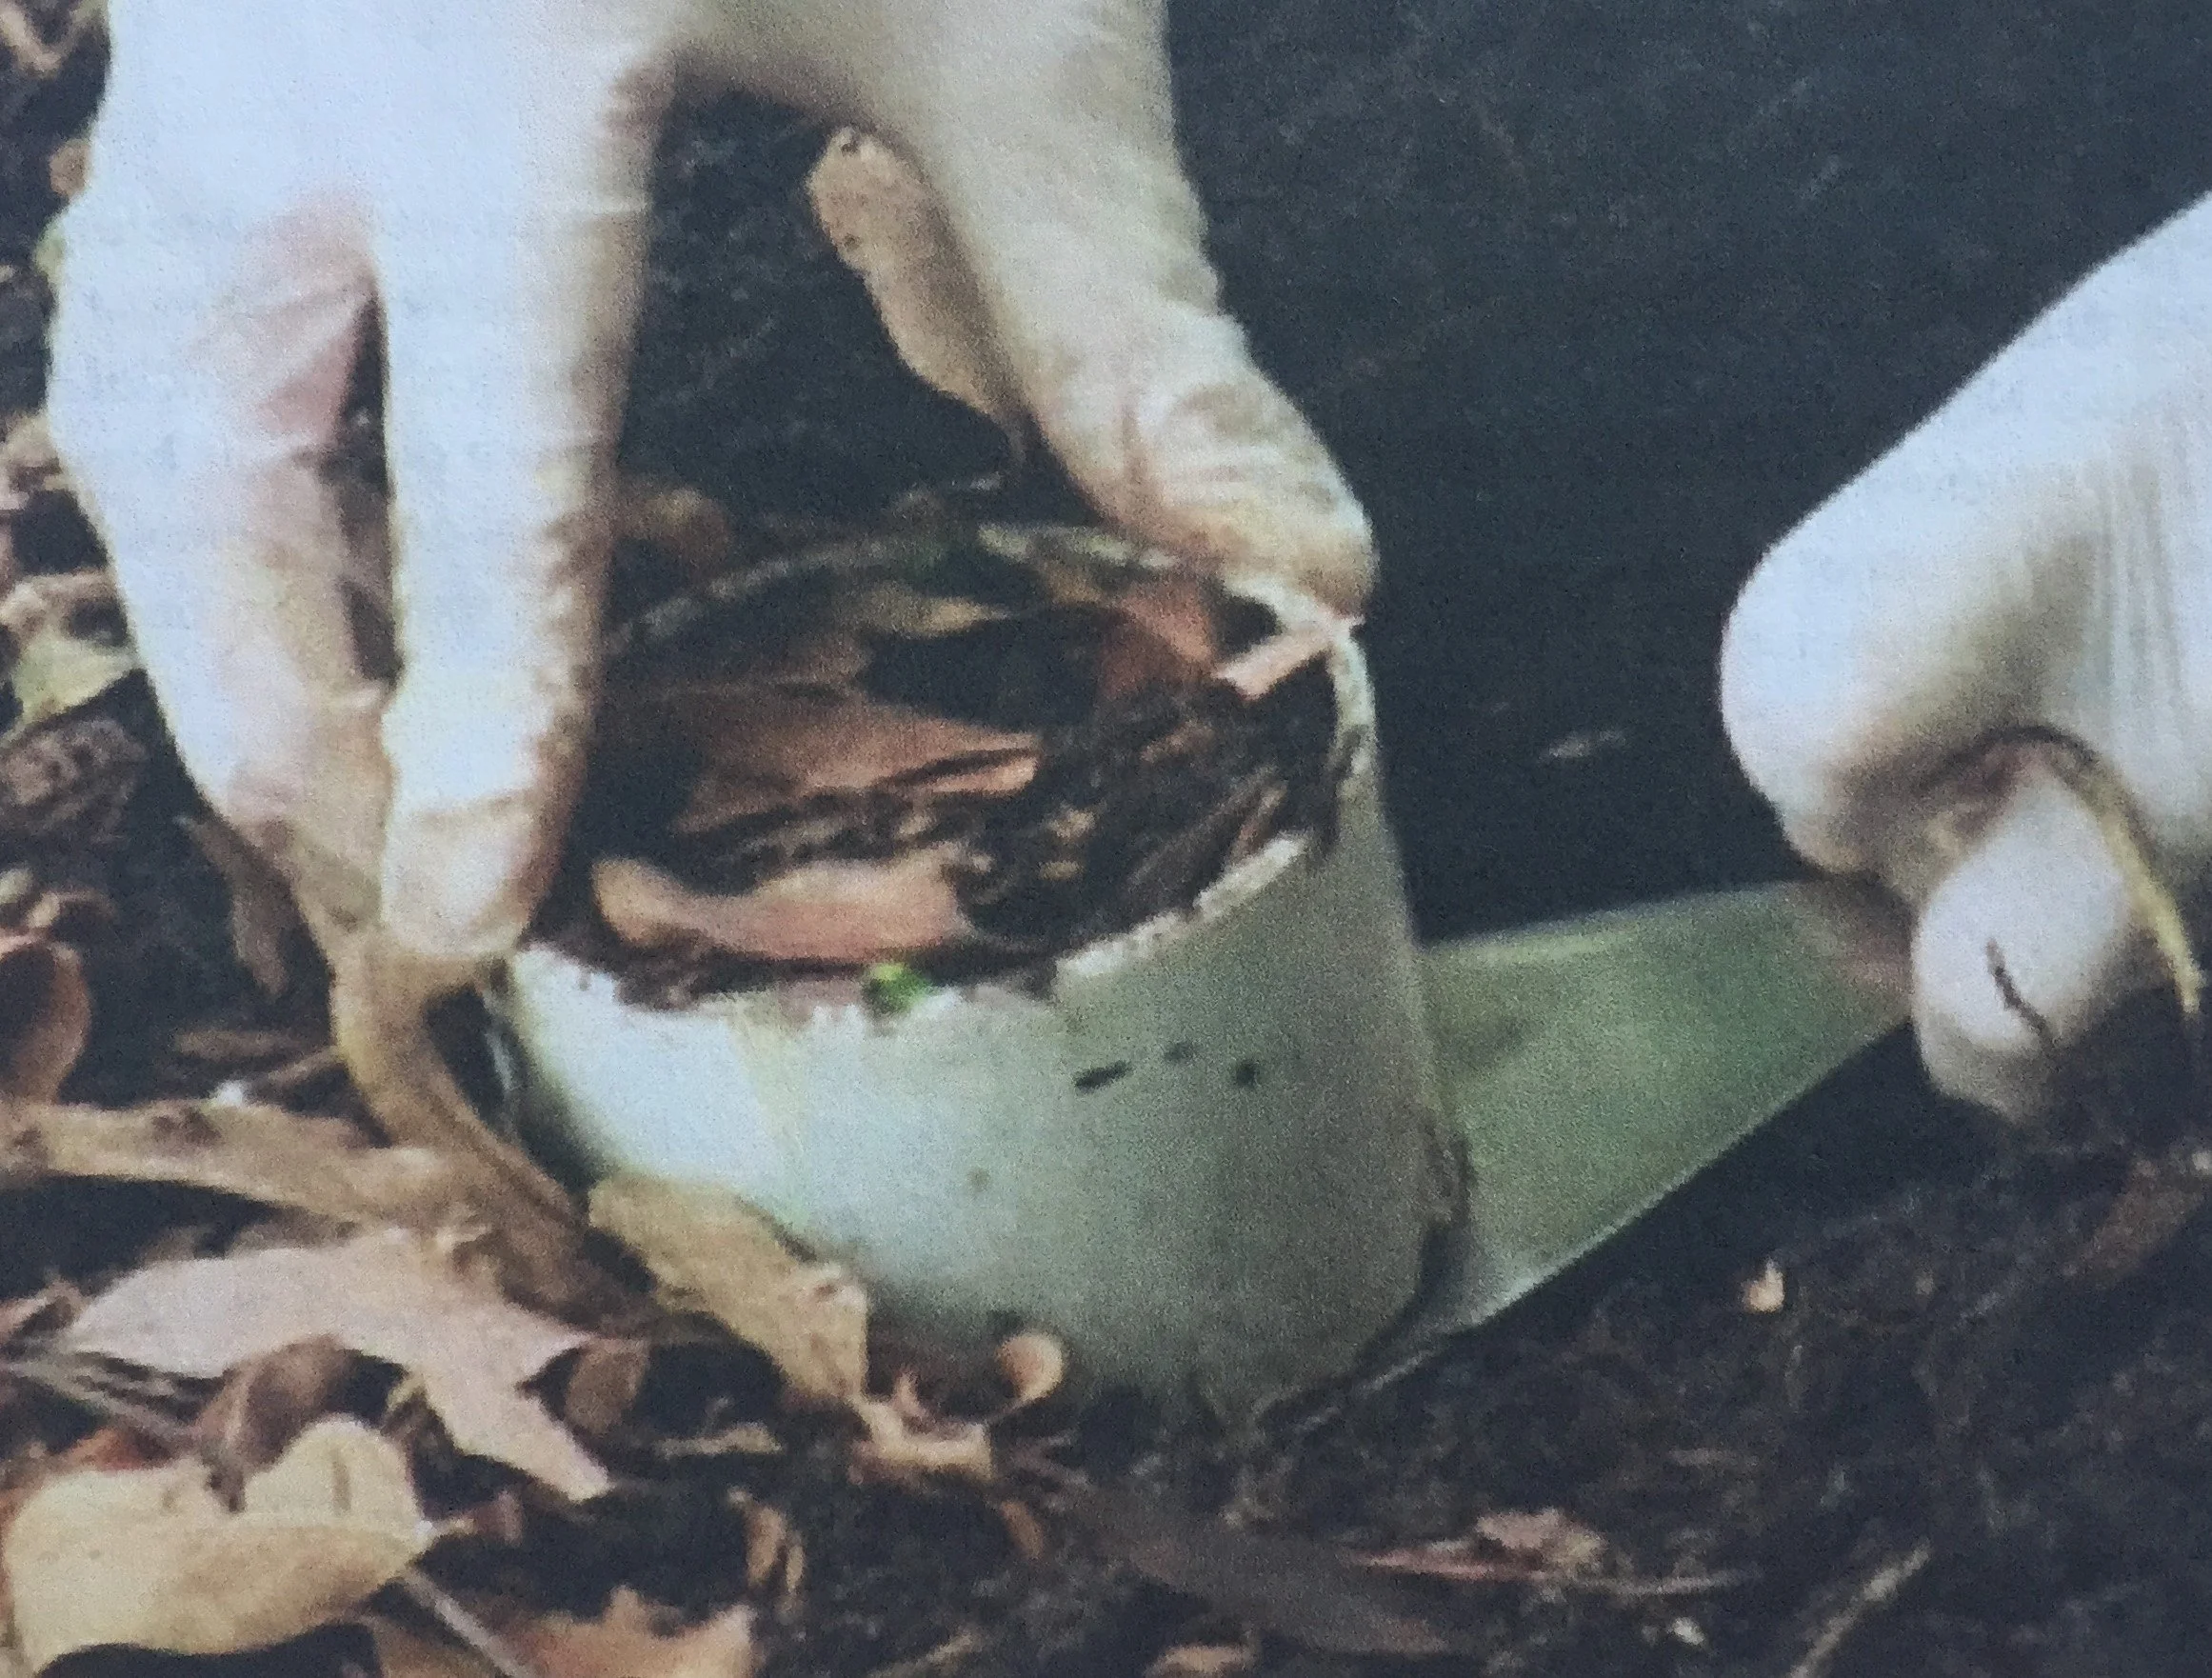
Soil Sampling Technique
Salinity and Acidity in Soil
From: https://www.soilquality.org.au/factsheets/salinity-nsw#
Background
Water passage into roots is either by passive diffusion or by osmosis (see Years 7-8 Water), both of which are regulated by the ionic concentration (see Glossary) within and outside root cells. When the ionic concentration of soil is disrupted, as in a low (or high) pH, a plant’s ability to extract water is reduced. The essential nutrients it contains, such as NPK, Ca Fe and Zn become unavailable to the plant, resulting in nutrient deficiency and oxidative stress. Some ions become toxic. If the level of salts in the soil water is too high, water may flow from the plant roots back into the soil. This results in dehydration of the plant, causing yield decline or even death of the plant.
Salinity
Factors involved in the salinisation of soil are:
• Salt minerals in the parent rock
• Poor drainage
• Addition of chemicals in agricultural fertilisers
• Salty groundwater
• Evaporation
• Seawater contact
• Climate change in an existing arid climate
• In the Wheatbelt, land-clearing has had a major effect on the salinisation of the soils.
• Plants, particularly trees, maintain a fresh water layer in surface soil. Removing trees allows the salt water underneath to rise.
Crops vary in their tolerance to salinity; those that are most resistant to saline soil are sorghum, oats, barley, rye, wheat, canola, safflower, and sunflower.
Depending on the drainage of the soil, these crops will grow in a salt concentration between 2 to 6 dS/m (Equipment, TOOLBOX).
Salinity is measured as the concentration of ions, or Total Dissolved Salts (TDS), and affects almost all aspects of plant development, including germination, vegetative growth, and reproductive development.
Degree of acidity in soil has marked effects on the ionic concentrations required for plants to absorb essential nutrients.
Acid soil (low pH) for example, decreases the availability of major plant nutrients such as nitrogen, phosphorus, potassium, sulphur, calcium, magnesium and the trace element molybdenum.
Alkaline soils (high pH) may increase the availability of some elements to toxic levels, such as aluminium, manganese and molybdenum, and, conversely, immobilise others such as phosphorus.
Soil acidification occurs naturally very slowly as soil is weathered, but this process is accelerated by productive agriculture.
For acid soils, the most practical management option is to restore the optimal pH level with the addition of lime.

Salt accumulation in soil From https://www.fao.org/3/cb7247en/cb7247en.pdf

Impact of salt on plant growth. From: https://www.fao.org/3/cb7247en/cb7247en.pdf
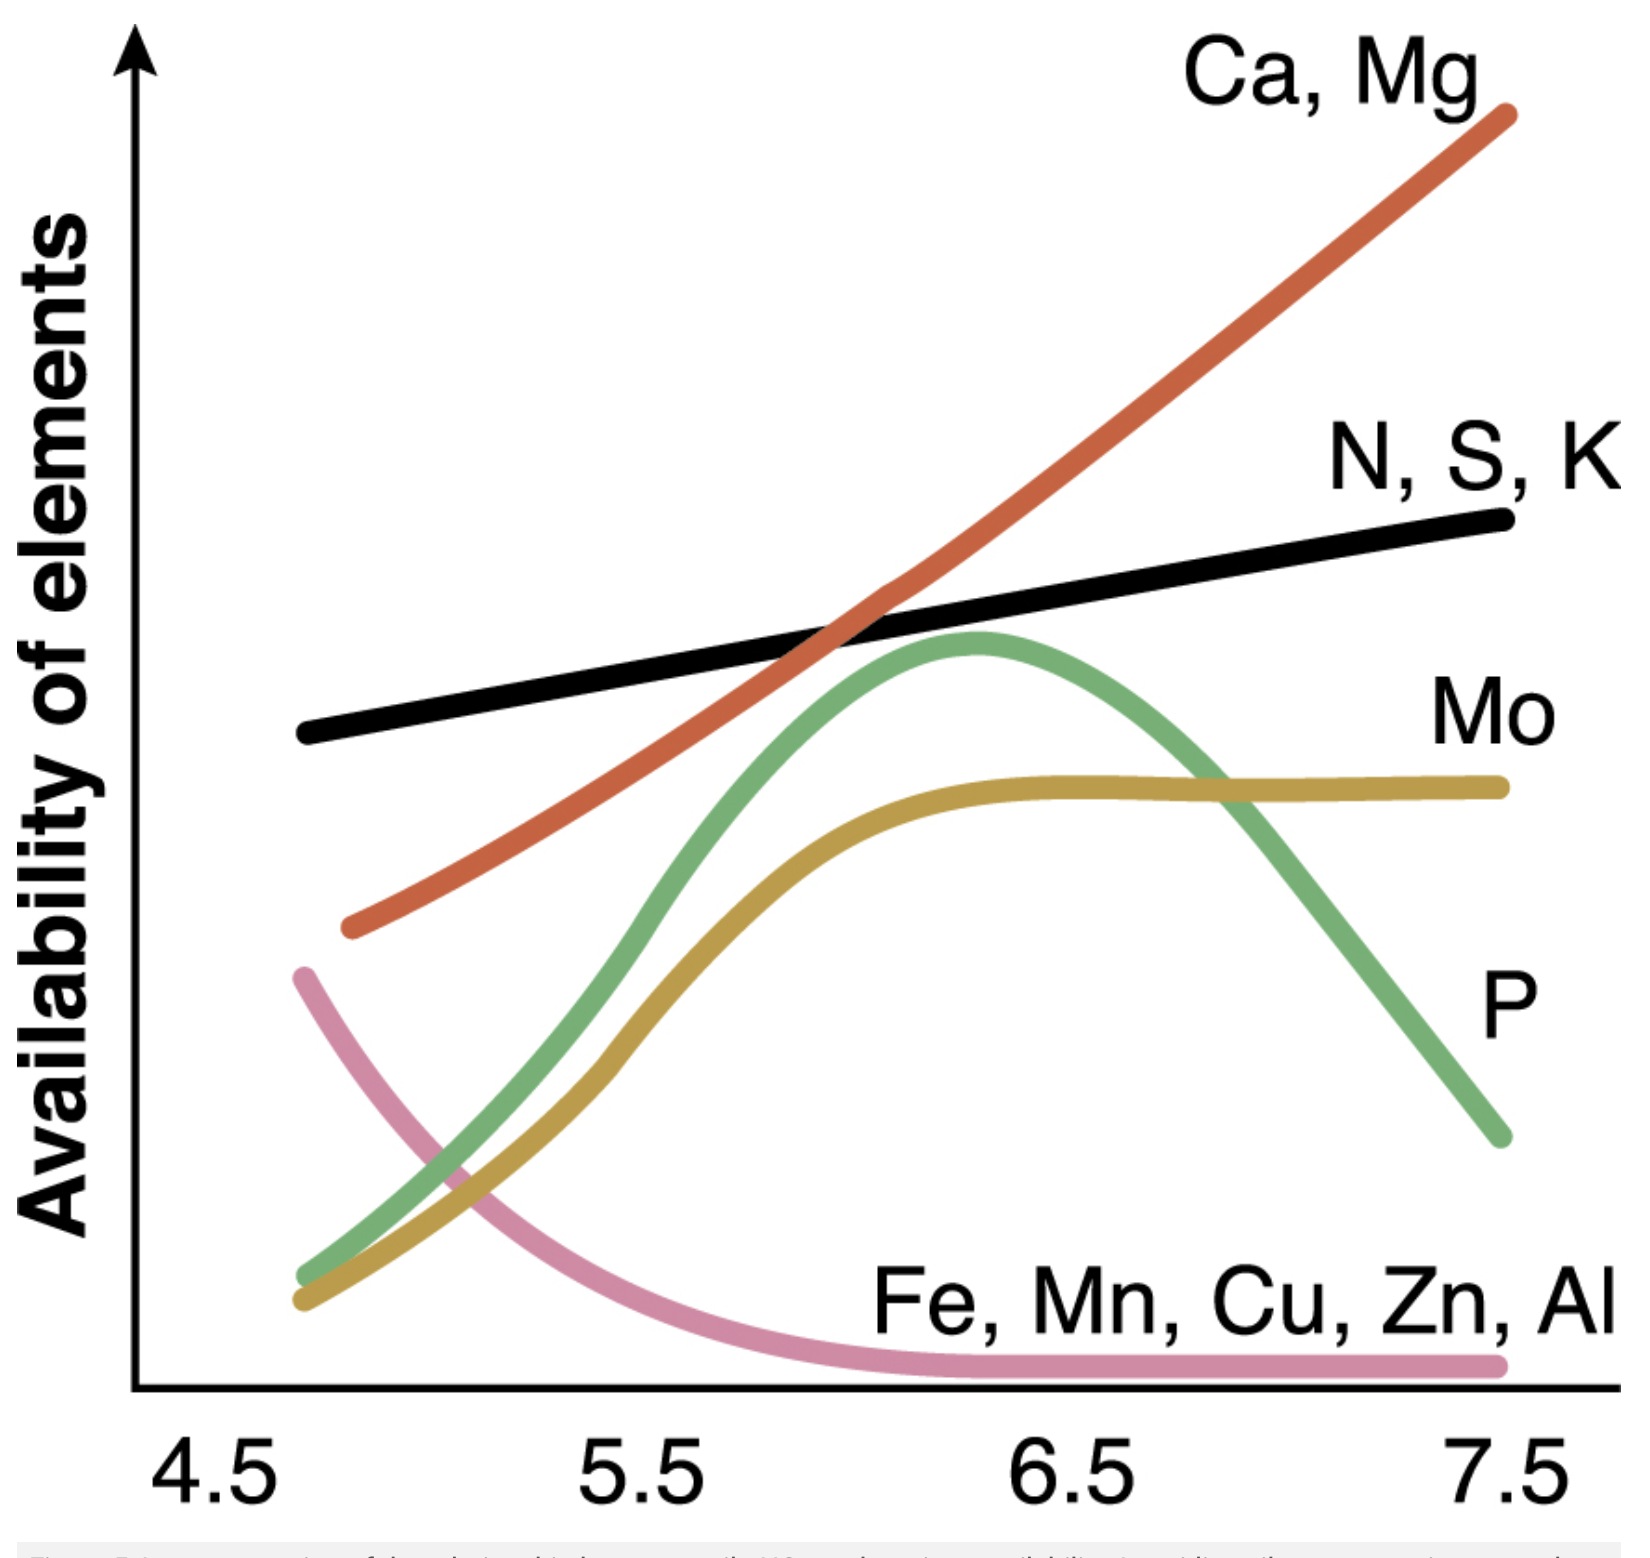
Effect of pH on availability of elements. From: https://www.agric.wa.gov.au/ soil-acidity/effects-soil-acidity?page=0%2C1
Activity
Measure Salinity (Ionic Concentration) and pH (Acidity) in 2 Soil Samples:
MATERIALS
• soil samples from 2 sites (as in Activity 3)
• handheld device measuring both electrical conductivity (ionic concentration) and pH (acidity) (Equipment stockists, TOOLBOX)
• 2 x 250ml beakers
• Distilled water (dH2 O)
METHOD
1. Calibrate the Electrical Conductivity/pH handheld probe according to the instructions.
2. Weigh 20mg of soil and add to a 250ml beaker.
3. Add 100ml distilled water. This gives a 1:5 ratio of soil to dH2 O.
4. Stir for 2 minutes and leave to settle for 5 minutes.
5. To measure pH
• remove the electrode cap and switch ON.
• dip the electrode 1-2cm into the solution and stir.
• wait for the display to stabilise then record in the record sheet (WORKSHEET 2, TOOLBOX).
• rinse the electrode with dH2 O between each sampling.
6. To measure electrical conductivity (ionic concentration)
• dip the electrode 1-2 cm into the solution and stir.
• wait for the display to stabilise, then record the EC 1:5 reading and its units (for example dS/m, or mS/ cm) and record the results.
• enter results in a Class data sheet, and average for each site (A and B).
Interpreting the Results
Acidity (pH)
• Water molecules are in constant motion. When two molecules collide, they may split apart or dissociate and form hydrogen ions (H+) and hydroxyl ions (OH-). The concentrations of hydrogen ions in a solution is denoted as pH, with pH = - log [H+].
• It is generally reported on a scale of 1 to 14. A pH of seven is neutral; values less than seven are acid; and values greater than seven are alkaline, or basic.
• pH is a logarithmic scale, which means that every one unit change on the pH scale corresponds to a 10-fold change in hydrogen ion concentration. For example, a solution with a pH4, is 10 times more acidic than a solution with a pH of 5.
• In a healthy soil, pH should be in the range 5.5 to 7.5.
Electrical conductivity (EC)
• EC measures the ease with which electricity can pass through the water sample, and is proportional to the concentration of dissolved salts in the water (ionic concentration).
• EC is usually measured in deci Seimens per metre (dS/m), or TDS (Total Dissolved Salts).
• Distilled water has an EC of 0 dS/m, sea water has an EC of 35–55 dS/m. • Depending upon the degree of drainage in a soil, most crops will grow in a salt concentration between 2 to 6 dS/m.
To convert Electrical Conductivity (EC) to Total Dissolved Salts (TDS)
• TDS (mg/L) = EC (mS/cm) x 0.6
Soil as an Ecosystem
No-one is sure where the first life particles came from – some say from outer space – but these particles were the beginning of soil-life. They were able to take in the inorganic molecules and use them for growth. At some time in evolution, these life-particles developed a capacity to harness the energy from the Sun, to grow and proliferate over the rock’s surface. These were the early plants, such as lichens, algae, and moss, that absorbed the surface elements, living and dying over aeons. They left behind a surface layer of their decaying cells which contained carbon, nitrogen, phosphorus, and oxygen, enriching the top layer, and allowing the evolution of larger plants to grow (as long as there was water, in the form of rain).
When plant material becomes buried, particularly in waterlogged soils, the oxygen concentration is low (anaerobic), and soil micro-organisms, such as bacteria, micro invertebrates and fungi, break down the plant material to form peat.
Peat is a rich source of fuel, being high in carbon, but should not be harvested, as it is a rich biodiversity ‘sink’, and is not renewable.
Humus is the dark material in soils, the result of long-time decay by bacteria of both plant and animal tissues.
From the Expert
Lynne Abbott says ...
“Soil is the baseline support for plants and animals in all ecosystems.
It is a very important layer which could be shallow or deep depending on the location and source materials. Soil formation is extremely slow, so it is essential to protect and preserve it as a critical resource. Organisms living in soil contribute to many processes including nutrient cycling from organic matter, the uptake of nutrients by plants, the maintenance of soil pores for water and aeration, and the friable structure of soil particles. Soil in agricultural ecosystems needs to be managed to prevent loss by wind or water erosion, and in a way that supports the ongoing beneficial contributions of small animals, bacteria, fungi and other microscopic organisms.”

Activity
Investigate the Relative Proportion of Inorganic and Organic Content in Soil:
This is a simple method that may be set up at the start of working with soil, as some time may be needed for the 2 components to separate. (Courtesy, Hilary Salmon, Manning PS)
SAFETY
• When handling soil, always wear safety glasses.
• Do not ingest or smell the soil, and avoid inhaling its dust. Harmful bacteria and fungi could be present.
• Wash your hands thoroughly with soap and water afterwards.
METHOD
1. Remove the top layer of leaf matter and twigs, and collect about 100 to 200 g of topsoil, digging down to about 10cm.
2. Transfer into a large, glass, straight-sided jar, up to one-third, with the soil sample.
3. Fill the jar to the top with water, and add a few drops of liquid detergent.
4. Leave to stand in the laboratory until the organic layer becomes visibly discrete from the sand layer beneath. Depending on the effectiveness of the detergent, this may take a week or two.
5. Measure the height of both layers (cm) and express the organic content as a percentage.
6. Research on the internet how the organic content compares with other regions.
Activity
Measure Soil Organic Matter in 2 Sites:
This is a gravimetric method for measuring and comparing organic matter in 2 different soils, Sample A (natural bush) and Sample B (farm or composted vegetable garden).
MATERIALS
• 2 top soil samples, free of litter
• A balance weighing to 0.01g
• 6 x 250ml beakers. (3 beakers Sample A, and 3 beakers Sample B).
• 2 large beakers
• Filter paper (Grade 3 from Labtek.com.au)
• 6 funnels
• Trowel, or small spade
• Worksheet 2 - Organic matter in soil (TOOLBOX)
METHOD
1. Collect topsoil (with a small trowel), free of litter, from two different origins (Sample A and Sample B).
2. Place samples in self-seal plastic bags, labelled with the origin.
3. In each of 2 large beakers (A and B), add soil sample (about 100 - 200g) and pour in enough water to double the height of the sample. Stir thoroughly to mix, and leave to settle. It may take several hours (or overnight) for the lighter, organic matter to float above the inorganic layer (sand particles).
4. Set up 3 beakers (A1,2 and 3) as replicates of soil sample A, and 3 beakers as replicates of soil sample B (B1,2 and 3).
5. Take 6 filter papers, weigh each one’s mass to 2 decimal places, record the mass in Worksheet 3, TOOLBOX).
6. Line each funnel, with the respective filter paper. (Concentrate here!).
7. Decant the organic matter from soil sample A into beakers A1 to A3; and the organic matter from soil sample B into beakers B1 to B3. In order to do this, pour the surface material through the funnel, making sure to leave the inorganic material (sand particles) behind in the beaker.
8. Repeat this step 2 to 4 times, until you have separated off all the organic matter (ie. the supernatant is clear, or all the supernatant has been decanted).
9. Leave the filter papers to dry (overnight, or in the oven).
10. When dry, weigh each filter paper again (filter paper + dried organic matter), and add to Worksheet 3.
11. Subtract W1 from W2 to arrive at the weight of the organic matter in each beaker.
12. Average the 3 records in soil samples A and B, to arrive at a difference in organic matter between the natural bush and a farm or vegetable garden.
13. Write up your experiment.