Module 2
Natural Waters
Water in the Wheatbelt
There are 14 river systems in the Wheatbelt. To the east, there is an extensive system of streams, or drainage lines. These are ancient remnants that now only flow during wet years, draining into chains of saltlakes.
Wetlands
In the past, wetlands were viewed as wastelands and were often reclaimed for farming, housing, and waste infill. Today, they are recognised as one of the most important and productive ecosystems on Earth.
• They provide habitat, water, and an abundant food source for a diverse range of animals including birds, frogs, invertebrates, and fish. They are nurseries for fish and migratory bird populations, and in times of drought, they provide vital refuge areas for plants and animals.
• The food supply in these waters consists of micro and macro-invertebrates, insects, crustaceans, molluscs, and worms; all are a vital part of the food chain. Together with bacteria and unicellular organisms, they help to break down leaves, bark and twigs that fall into the water, and can even change their environments by moving soil, sand, or pebbles around.
• Scientists use the number and types of aquatic macroinvertebrates in a waterway to determine how healthy it is.
Toolibin Lake is the only remaining example of a permanent wetland in the Wheatbelt.
Situated in the upper Blackwood River catchment, near Narrogin, it is surrounded by extensive woodlands, principally sheoak (Casuarina obesa) and paperbark (Melaleuca strobophylla) trees.
• The lake was once a freshwater wetland, and home to rich plant and animal communities.
• Clearing for agriculture has brought marked changes. By 1972, 91% of the total catchment area had been cleared for agriculture, changing deep rooted native plants to shallow-rooted crops that don’t use all the rainfall.
• As a result, this unused rainwater either runs off or percolates below the root zone into the groundwater.
• Rising groundwater levels have caused the saline groundwater under Toolibin Lake to rise virtually to the floor of the lake.
• Evaporation further concentrates the salts at the surface.
https://www.agric.wa.gov.au/soil-salinity/dryland salinity-western-australia-0
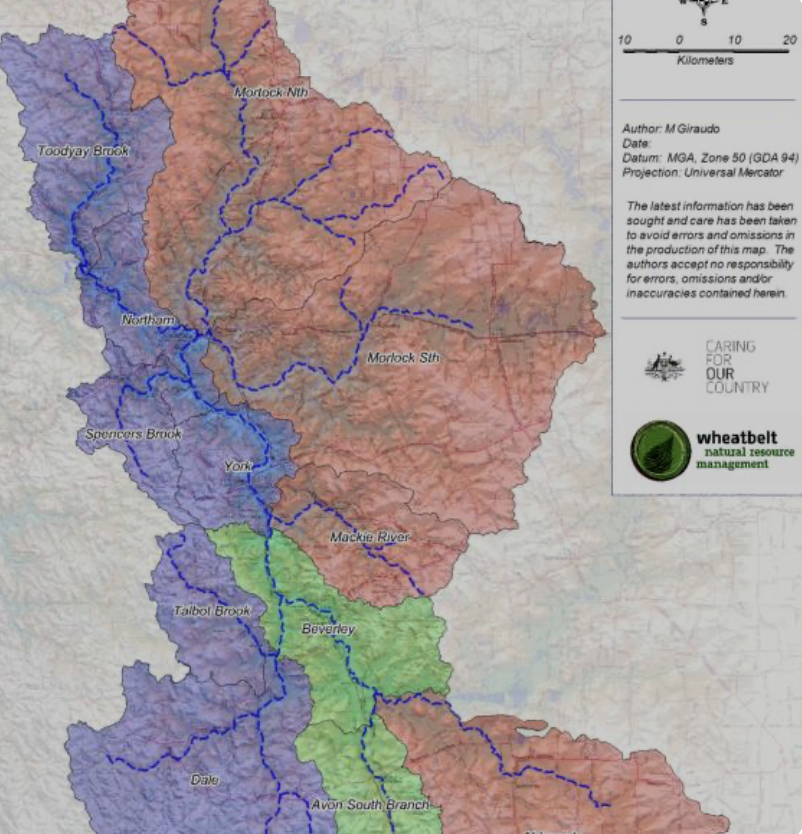
Avon Arc River Catchments . From: River Systems in the Wheatbelt, www.wheatbeltnrm.org.au
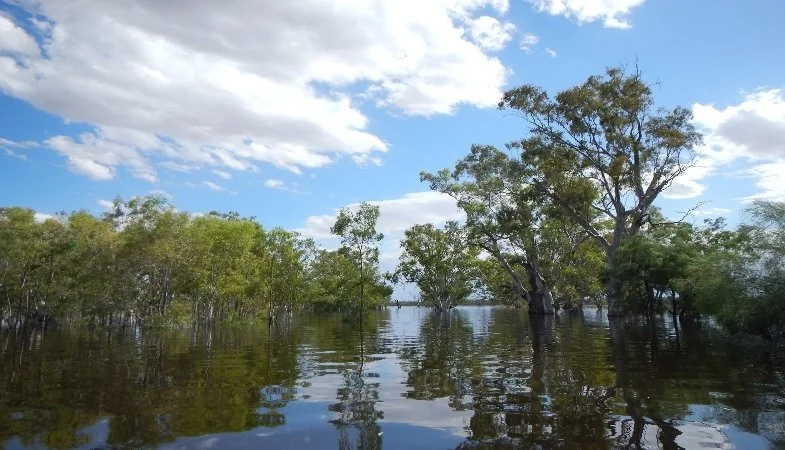
Toolibin Lake. Photo Jacquie Nichol
Gnammas and Rock Pools
There are approximately 5000 exposed rocky outcrops (or tors) and flattened platforms throughout the Wheatbelt. The impervious nature of the granites has allowed many of them to be associated with seasonal water in rockpools, and permanent water in the form of gnammas. How do these form?
1. Initial cracks and flaking in the rock surface in the granite and weathering over long time (by wind, water and ice) has left deep holes that collect seasonal rainfall. Depending on the nature of the rock, gnammas are either pit-gnammas (circular shaped with deep water) or pan-gnammas (shallow water and irregularly shaped)(1).
2. Some gnammas may have been fashioned by the Aboriginal inhabitants themselves.
The gnamma shown in the photograph, situated in the eastern Pilbara, is thought to have been fashioned by Aboriginal people and demonstrates a degree of technological knowledge. It is told that the Aboriginal people recognised a sloping terrain around the granite and a depression in the rock, as a site for water storage. Their method was to light a fire in the depression, heat the rock sufficiently, and pour water on the coals. The repeated shock eventually deepened the hole. Certainly, long time association with the rock hole is apparent, evident from the grooves worn into the rock’s surface, as a result of Aboriginal people sharpening the spear heads.
From the late Kevan Davis…
“The people used to heat the rock up and keep pounding it until it got deep enough so that they could have a water hole. Some Noongar stories say gnammas were created in the dreamtime by the Wargal, the spirit snake that also made the rivers, lakes and wetlands. Another dreamtime story says that the row of five pit gnammas in Trayning were dug by a nyingarn (echidna) digging pits as he migrated south.”
Gnammas were of key importance to Aboriginal people.
...“Water kept our people alive, so gnammas were sacred. They were guarded and regularly cleaned. Slabs of rocks were placed over some smaller pit gnammas to reduce evaporation and prevent wildlife from falling in and drowning…. When a group of people first arrived at a gnamma, only the eldest, the decision maker, would drink the water at first. This Elder would ensure that the water was safe. The others would wait and then take turns to drink one by one…. When we arrive at a gnamma, we throw in some sand to let the water spirits (wirrn) know that we are peaceful. We believe that the spirits are everywhere; there in the trees; in everything that’s living…”
From: Ballardong Elder, the late Kevan Davis In: The Derdibin Gnamma Storybook https://www.resources.wheatbeltnrm.org.au/knowledge-hub/the-derdibin-gnamma-storybook
Teacher Note. The Derdibin gnamma featured in the Derdibin Gnamma Storybook is situated at the base of Derdibin Rock, in a private farm in the Central Wheatbelt.
The Storybook is a valuable resource for teachers. It contains information on how gnammas form, the fauna that can be found in them, where they are located throughout the Wheatbelt and which gnammas may be visited.

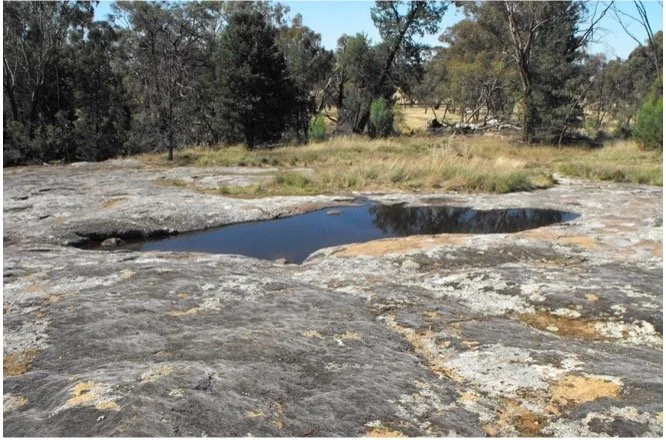
Rook Pool on Nookaminnie Rock, Quairading.

Aboriginal Gnamma Hole. Photo Mitch Ladyman
Saltlakes
Salt lakes are common in the Wheatbelt; they are the remnants of old river systems that once flowed, emptying their salt load (leached from soil and rocks) into the ocean.
· As the planet has dried over the millennia, the lakes and rivers no longer flow; they have become land-locked, filled with sediment, and no longer able to flush out their salt load.
· Today, these saltlakes may have a salt concentration up to 8 times that of the concentration in seawater, 35g salt/litre.
· Lake Brown, in the far eastern Wheatbelt, between Mukinbudin and Nungarin, is an example of what was once a wetland that has been shaped over millions of years by climate and geology.
· When significant rain falls, salt lakes become functioning aquatic ecosystems, with aquatic flora and fauna, physiologically adapted to the salty conditions, and usually lying dormant as buried seeds and eggs, awaiting the right conditions to grow. Life includes the adapted brine shrimp (Paratemia sp.) and the alga, Dunaliella salina.
· Algae are the ancestors of modern plants; fossil algae date back to 1.2 billion years ago. Algal cells have chloroplasts that photosynthesise, and take in a significant amount of carbon dioxide from the atmosphere. Other inhabitants are the microscopic plant-like organisms, phytoplankton, the base of the salt-water food web.
· Periodically when water is warm, slow-moving, and full of nutrients, algae and cyanobacteria rapidly grow out of control, or ‘bloom’. The variation in colour of the blooms reflects the nature of the chloroplasts in the organisms, and the pigment they contain.
· Green algae have chlorophyll in their chloroplasts.
· Red/pink algae, such as Dunaliella salina, have the pigment b-carotene in their chloroplasts, which absorbs energy in the blue/red/green wave lengths, reflecting back the pink/orange wavelengths. This alga provides the colour of pink lakes, like the Pink Lake in Badjaling, near Quairading.
How are Natural Waters Polluted?
Natural inland waters, such as wetlands, rivers, and lakes are rich aquatic ecosystems (see Years 3 -4), with complex interactions between plants and animals. Plants require the basic components of photosynthesis, carbon dioxide, water, and sunlight. Animals require oxygen to generate energy for their growth and reproduction.
Any chemical alteration to this environment, such as low levels of oxygen, or high levels of acidity, alter this fundamental relationship between plants and animals, with effects ranging from mild to catastrophic.
Acidity
· The level of acidity in surface waters should be close to a pH measurement of 7, i.e. neutral. Lower pH levels (i.e. more acidic) are not tolerated well by animal life. Rainbow trout begin to die at pH 6 (i.e. 10 times more acidic than pH 7); frog’s eggs, tadpoles, freshwater crustacean, and Mayfly larvae die at pH 5.5; all fish die at pH 4.2.
· How is acidity increased? Carbon dioxide, the waste product from mining sites, chemical dumps, or power plants, is the major cause of raised acidity in surface waters. When carbon dioxide reacts with water, carbonic acid is formed.
Oxygen
· Oxygen is critical for the health of aquatic life. Animals, such as macroinvertebrates and fish, as well as plants, need oxygen to metabolise food (or respire). For healthy growth, dissolved oxygen needs to be between 5-6 ppm (5- 6 mg/L).
· How is oxygen renewed? By diffusion from air at the water surface. If water is moving rapidly, as in a stream, there is greater contact of water with the air. Thus, oxygen dissolves more readily in fast moving water than if the water is still, as in a wetland.
· Oxygen is also renewed from photosynthesis in algae and aquatic plants. At night, however, plants, like animals, respire and take in oxygen, with the lowest levels of oxygen in inland waters just before dawn.
Temperature
· Temperature affects the amount of dissolved oxygen in water. The lower the temperature, the more oxygen can dissolve. At 0o C , the maximum level of oxygen is 14.6 mg/L, and at 30o C the maximum level is 7.56 mg/L.
· At warmer temperatures, micro-organisms reproduce at a faster rate, utilising the available oxygen as they respire. This may lower the oxygen concentration in the water.
· An increase in temperature may also be a sign of worsening health of surface water. If the temperature is usually 20o C at a certain time of the year, but begins to measure 23o C, it may indicate nutrients in the water are increasing due to agricultural runoff.
Nitrates, phosphates
· Compounds such as phosphates and nitrates are found in fertilisers. They reach water systems through agricultural runoff, and stimulate excessive growth of aquatic plants, including algae. This leads to an algal ‘bloom’ (or eutrophication).
· The algal ‘bloom’ eventually dies off and is decomposed by bacteria. Bacteria use significant amounts of oxygen during decomposition, which leads to a decrease in oxygen available for animal life.
· Safe levels for animal health are less than 50 mg/L (<50ppm) of nitrate and less than 40 mg/L (<40ppm) of phosphate.
Salinity
· Plants and animals have evolved ways that allow them to function in mild saline concentrations. However, sudden increases in salt concentrations (particularly Na+) make it increasingly difficult for the cells of plants and macroinvertebrates to adjust rapidly.
· The increased salt concentration has an osmotic effect (see Year 5-6); water is drawn from plant and animal tissue (such as macroinvertebrate and insect larvae) into the higher salt concentration in the surrounding water. Dehydration and death could be the result.
· Some animals (fish, for example) survive better than others; they take in water and salt via the processes of osmosis and diffusion, and by active transport of ions. The cells in their bodies are tolerant to big changes in salt concentrations. Thus, some fish speciestolerate the change from seawater to inland water during their lifetime. One example is the lamprey that enter rivers and migrates to fresh water upstream in order to breed.
· For most freshwater plant and animal life, the concentration of salts should be less than 1000 ppm (approximately 1g/L), although some species are more sensitive to levels than are others.
Turbidity
· Turbidity negatively affects aquatic life by blocking sunlight and stunting the growth of aquatic plants and smothering aquatic organisms.
E. coli
· E. coli is a common bacterium found in the digested part of food in animal intestines. Presence of E.coli indicates contamination of the water by human sewage, or animal waste.
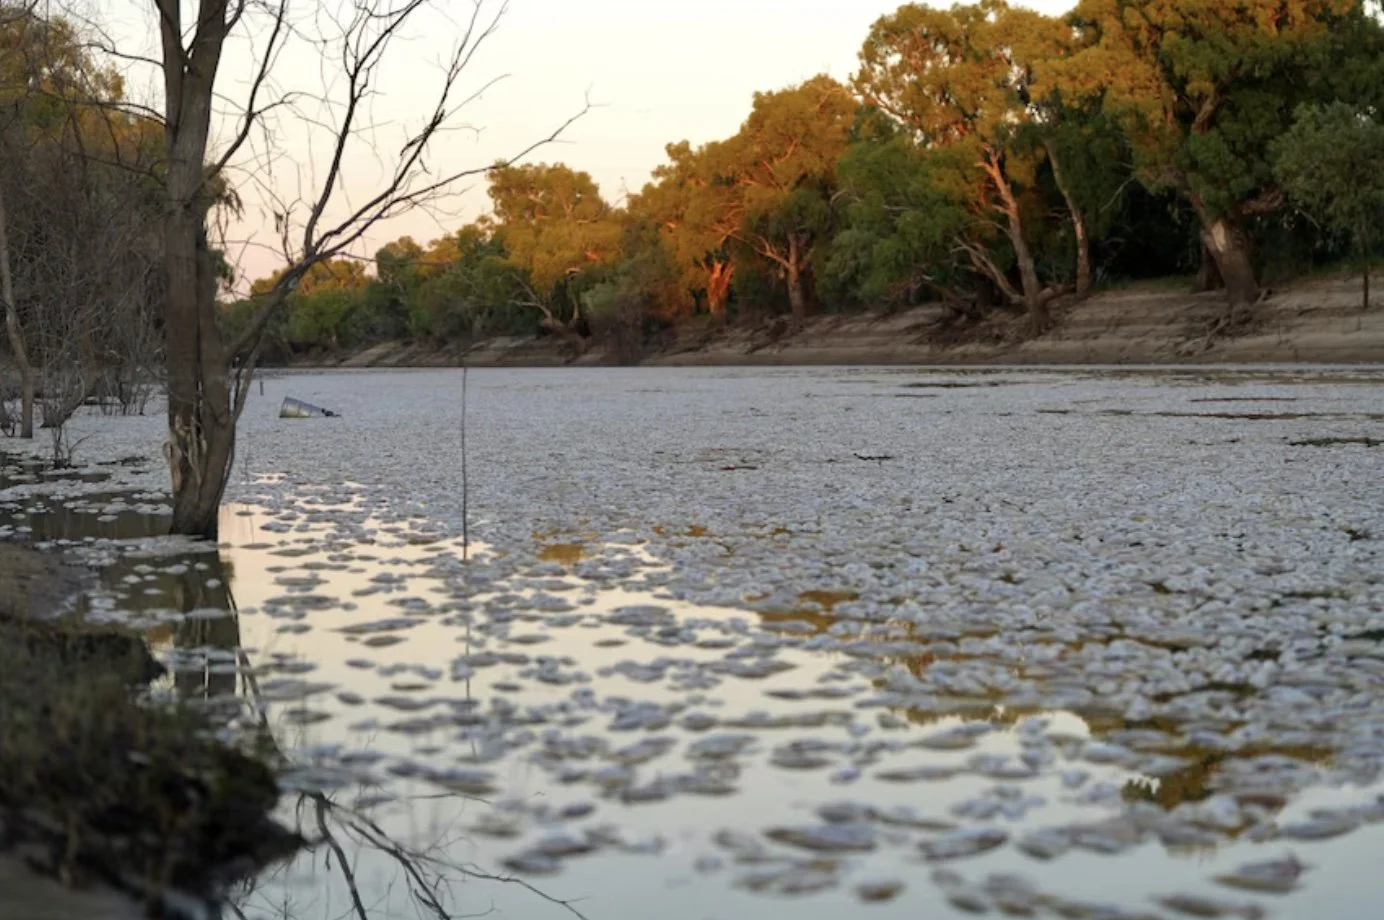
Photo, Fish Kill in the Murray-Darling River System. https://www.abc.net.au/news/2023-03-18/nsw-menindee-mass-fish-kill-worst-in-region/102115184
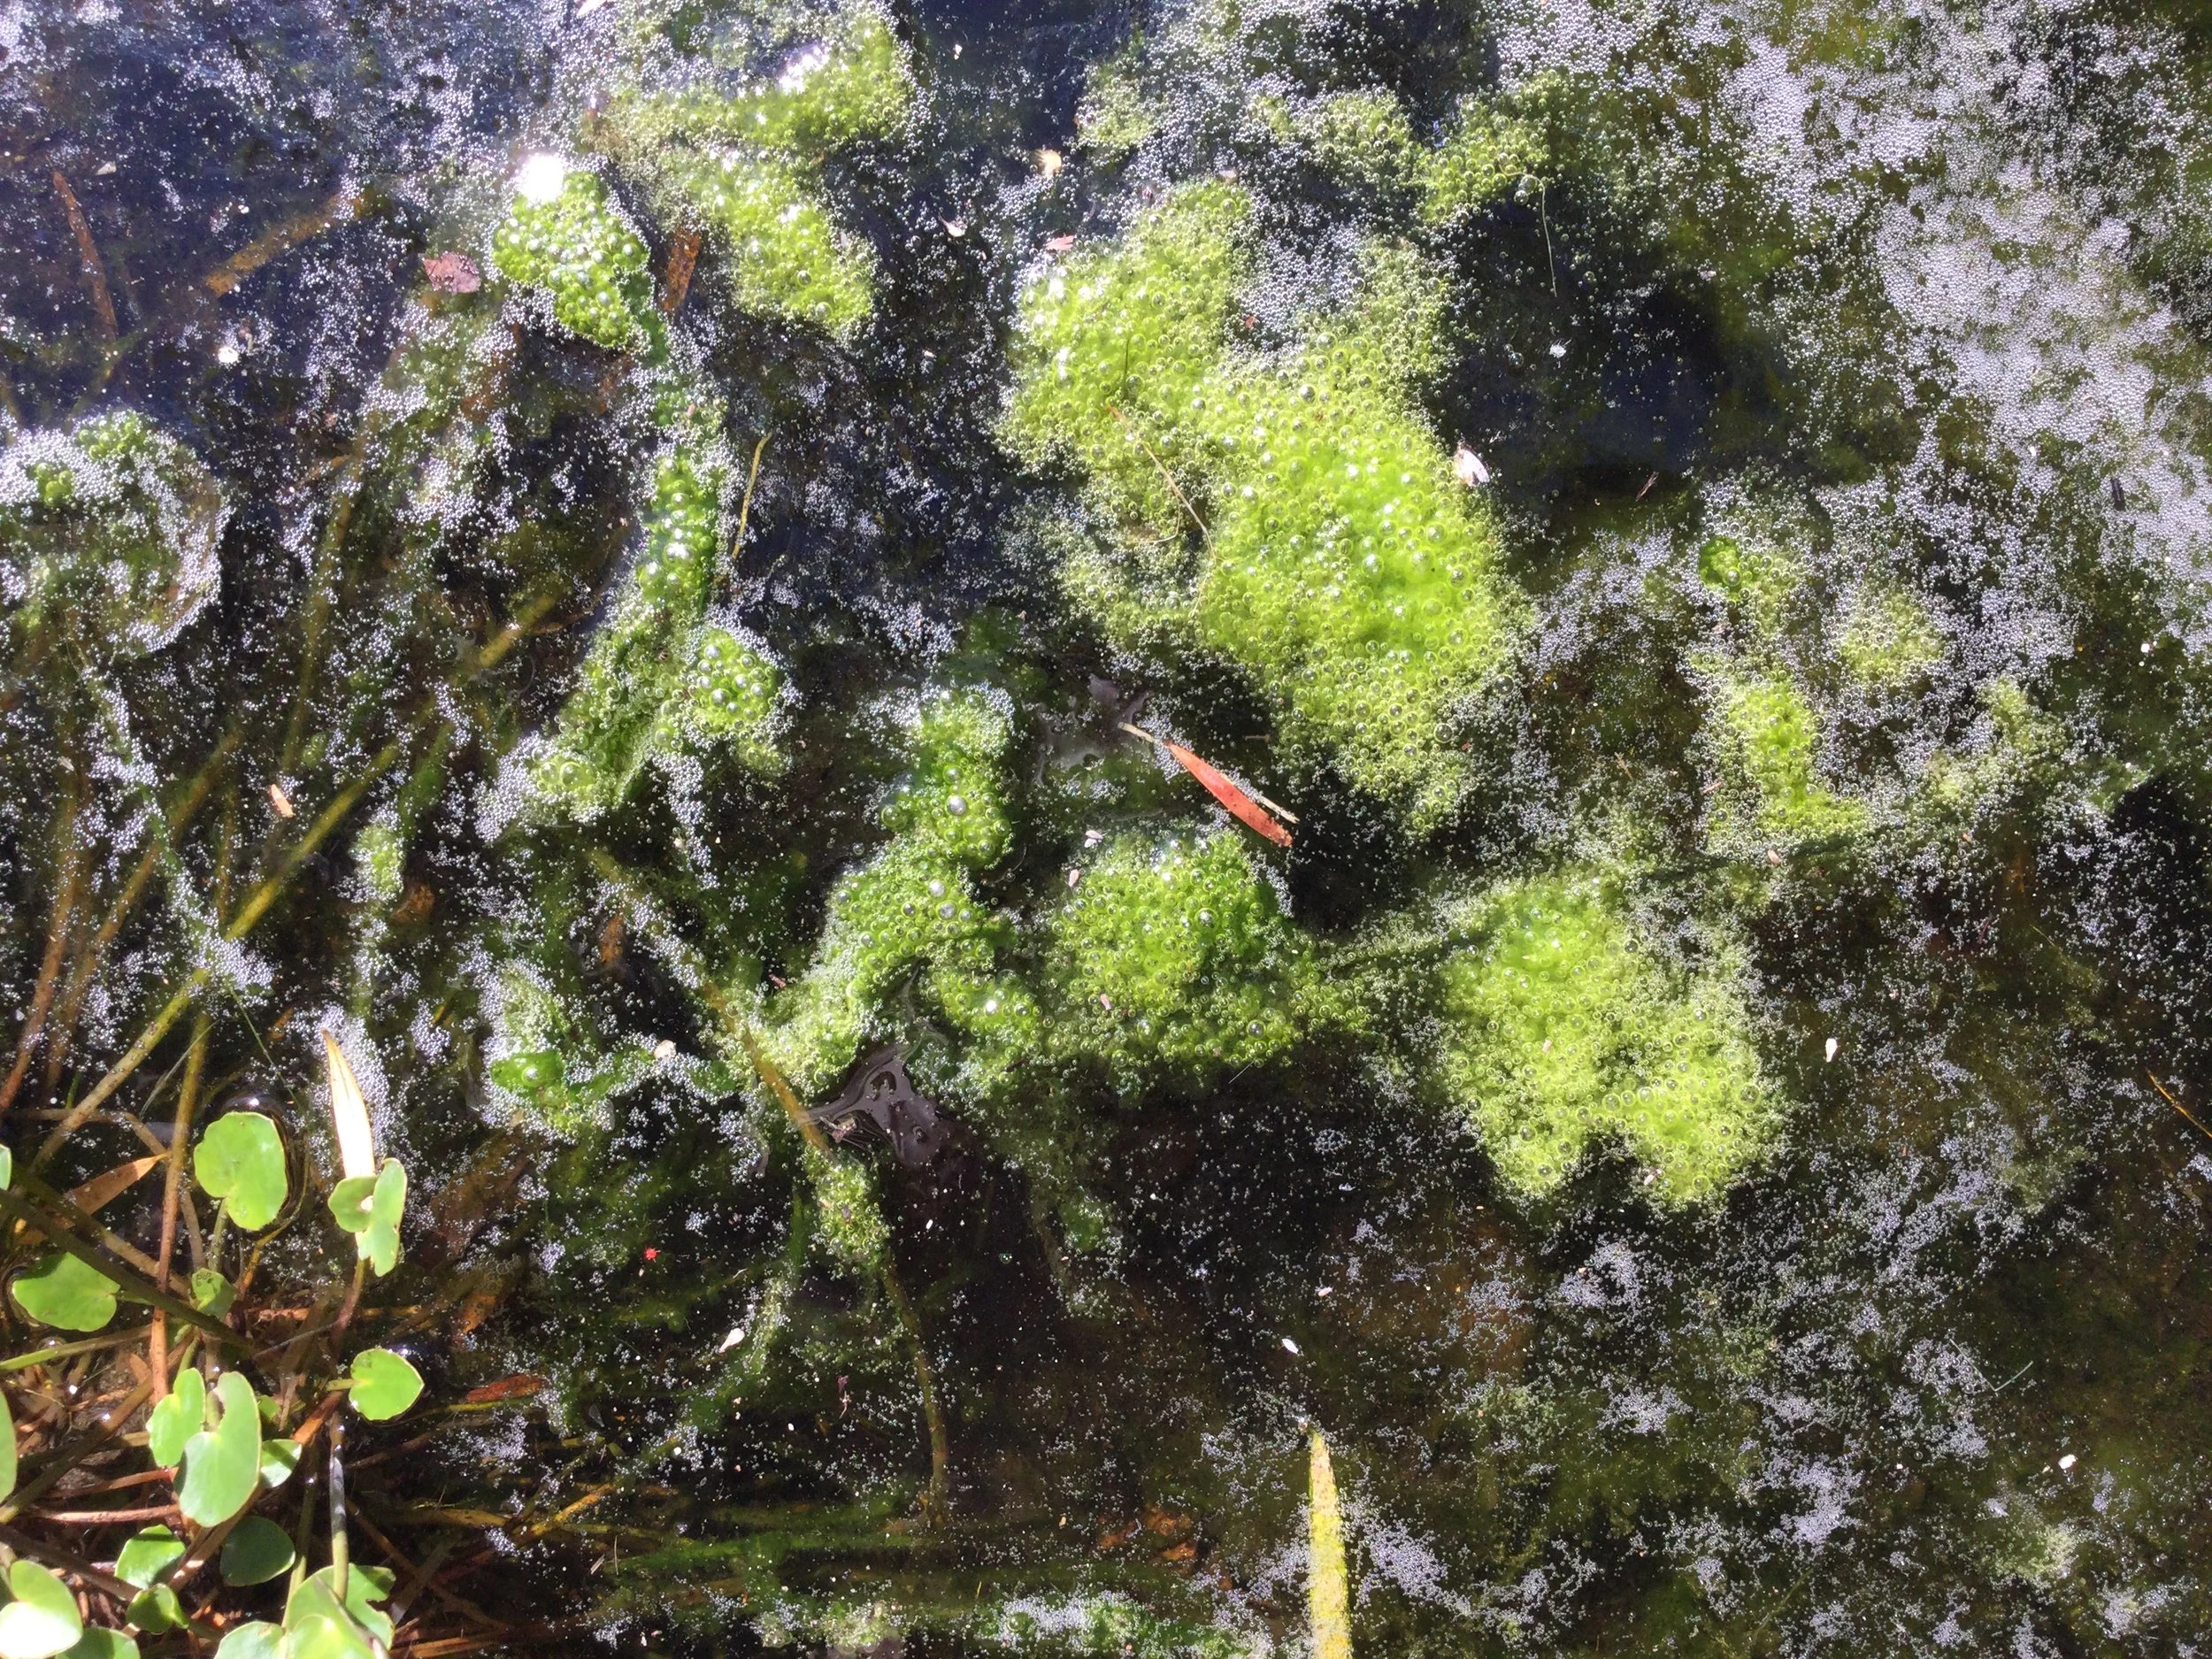
Eutrophication in a Garden Pond
From the Expert
… “The scientific world is still coming to terms with the huge diversity of more than 1000 species of aquatic invertebrates in the Wheatbelt, many of these species are not known from anywhere else in the world and this is especially true of the naturally saline playas, and ephemeral freshwater wetlands, including pools on granite outcrops. The diversity of water birds, and especially invertebrates, give important clues to the functioning of a wetland. For example, of particular concern is the spread of the introduced brine shrimp Artemia sp. in water systems that were formerly the preserve of our native brine shrimp, Parartemia sp. Salination, acidification, and weed invasion, as well as the changing climate, will have consequences for wetlands in the Avon Valley wetlands, and the Wheatbelt region…”
Forward by Dr Brian Timms to Aquatic Invertebrates and Water Birds of Wetlands in the Avon Region (by Susan Jones, Cara Frances, Anna Leung, and Adrian Pinder, 2009) IN: https://www.wheatbeltnrm.org.au/ our-information/knowledge-hub?page=1

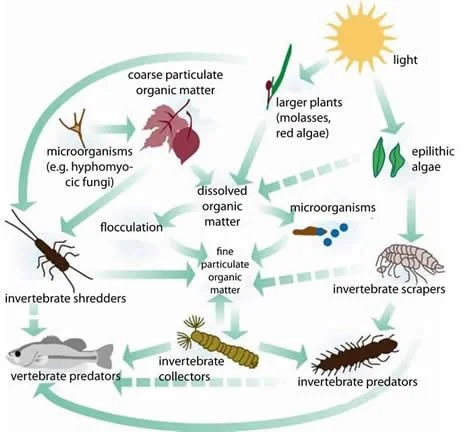
Example of an Aquatic Food Web Source: PrinctonHydro.com
Aquatic macroinvertebrates, such as snails, worms, shrimp, midge and mosquito larvae, water mites and beetles, are an integral part of a healthy water ecosystem. They are the food for carnivorous invertebrates, fish, and birds. They live all, or part, of their lives in water and their survival is closely linked to the quality of the water. Each type of macroinvertebrate needs particular environmental conditions to survive, reproduce and grow. Some are more sensitive to pollutants than are others; thus, monitoring these macroinvertebrates is a guide to the level of pollution in the water system.
Sensitive - organisms in the Orders Ephemeroptera (mayfly nymphs), Plecoptera (stonefly nymphs) and Trichoptera (caddisfly larvae), collectively known as EPT are very sensitive to pollutants.
Tolerant - Orders include Odonata (dragonfly larvae), Hemiptera (water strider) and Diptera (mosquito larvae/pupa).
Most tolerant are Chironomidae (nonbiting midges), subclass Hirudinea (leech), Phylum Nematoda (roundworms) and subclass Oligochaeta (segmented worms).
Activity
Measure Acidity (pH), Nitrate, Phosphates, Oxygen, Salinity, Temperature, Turbidity, E Coli in Surface Inland Water:
Preparation
1. Locate, beforehand, a suitable inland water
· It can be flowing or still. For safety reasons, deep water and very fast-flowing water should be avoided.
· Bare area such as sand banks and muddy beds without stones, wood or vegetation usually support few macro-invertebrates.
· Areas that have recently been flooded should not be sampled because macro-invertebrates may not yet have colonised them.
Directions are from Bruce Chessman, User Manual, November 2001 https://scholar.google.com.au/citations?user=4CXY4EwAAAAJ&hl=en
2. Plan. Discuss with students, an ACTION PLAN.
This should include:
· What are we aiming to do?
· What do we already know, about our inland water? (Aboriginal knowledge)
· Do we need permission to be able to carry out our project? (from State agencies, Aboriginal Corporation, nearby farmer)
· What might be some problems, and how will we overcome them?
· Which one of us will collect the sample? They may need high boots (Wellington).
· When we arrive, what will we do?
3. WORKSHEETS. Distribute WORKSHEET 4 – Field protocol (TOOLBOX) to each team of students (3 or 4) and discuss, WORKSHEET 3 - Data record for all waters (TOOLBOX), and WORKSHEET 1 - How to measure water parameters (TOOLBOX) for revision while performing the analyses on Country.
4. Rules. Students need to understand and follow rules when on-site, to keep everybody safe, protect the environment, and make the whole experience fun and enjoyable.
1. Work in pairs or groups and never alone. A creek has many potential hazards, and a lone student may get into difficulties without being noticed.
2. No running – the ground may be uneven and there may be hidden holes and objects to avoid.
3. Do not enter the waterway – all sampling should occur at the edge.
4. Never put hands or fingers near eyes or mouth after handling water. Any pollutants can irritate the skin and eyes and may be dangerous if swallowed.
5. Wash your hands well with soap when you get back to school and before eating. Antiseptic gels may be used on-site if there are no bathroom facilities.
6. Be sensible near the water and think of others. Don’t do things which may be dangerous, e.g. pushing another student near the water.
7. Look at and photograph animals and plants, but do not harm them.
8. Take your litter away. Put pH papers, paper towel, etc. into a solid waste container, to be disposed of in a garbage bin away from the site.
9. A rubbish bag is also useful to collect up other litter you may find, but take care with the kind of litter being picked up and watch for sharps and other dangerous objects. Students must tell a teacher straight away if they find something dangerous.
Materials
· WATER TESTING KITS. These should be obtained beforehand, from one of the following:
· Earth Force Low-Cost Water testing Kit (SKU 5911) https://www.vendart.com.au/earth-force-low-cost-estuary-monitoring-kit/?srsltid=AfmBOoq1-zDSOM3jy-QjDHD_SoDym6MyyWLCbY0KRnbVbvCLYGKRpEWX
from Vendart Diagnostics, or
· Earth Force Elementary Education Watershed Field Trip Kit (SKU 5906) https://www.vendart.com.au/earth-force-elementary-education-watershed-field-trip-kit/?srsltid=AfmBOooh61wsCNUsnpL939UCUnkUoIx33cWZeCIFBszJMED7NRQAC1B-
from Vendart Diagnostics, or
· Watertest Systems (LM3-5886) https://www.watertestsystems.com.au/earth-force-low-cost-water-testing-kit
· clean container, attached to a pole, for a 1 L water sample (I per group) (discuss with students why this must be clean, i.e. not contaminated with other chemicals, such as those from rust etc.)
· aquatic macroinvertebrate scoop net on a handle
· the water monitoring kit (with TesTabs for measuring pH, nitrate, phosphate, dissolved oxygen, E.coli)
· turbidity tube
· salinity probe
· 8L bucket for stream water collection (STOCK)
· 250ml beakers (1 per student group)
· large (ca 3L) lidded jar for macroinvertebrate sample
· 2 collapsible tables for student work
· disposable plastic gloves
· waterproof boots for the collector
Each student group needs
· 10ml test tubes with tops (x3) for measuring pH, nitrate, and phosphate
· permanent marker pen for labelling tubes (Pentel, or substitute)
· 5ml tube with screw lid, for measuring dissolved oxygen
· 1 E. coli test tube (special La Motte tube with screw-on lid and tablet for E. coli)
· measuring cylinder to measure 10 mL volumes
· test tube rack (1 per student group)
· pencils
· WORKSHEETS: Field Protocol, How to measure water parameters, and Data Record for all waters..
Method
A. Choose the sampling site
· For chemical monitoring, water that best represents the stream will be in a current; this ensures adequate mixing.
· Avoid stagnant slow moving water if it is not representative of the stream segment.
· If sampling from mid-stream, try not to disturb sediments when wading in.
· Face upstream, hold the pole (with container attached) and collect the water sample in front of you. Transfer to the bucket on the shore (STOCK sample)
B. Conduct Water measurements.
1. Students refer to their WORKSHEET - Field Protocol and sort into pre-arranged teams
2. Each team collects from the STOCK with a 250ml beaker. This should be sufficient to measure all parameters.
3. Different teams may take water samples from different parts of the water body (edge, still, or flowing) and compare between sampling sites. When you record, make sure you identify from which part of the water body the sample was taken.
4. Perform each test within an hour of collection. Using the Water Monitoring kit, students test for dissolved oxygen, turbidity, salinity, acidity, temperature, phosphates, nitrates, and E coli.
5. Have students refer to the WORKSHEET - How to measure water parameters and perform all measurements according to the instructions.
6. Enter up all results in the WORKSHEET - Data Record for all waters.
Collecting methods are adapted from: Waterwatch, South Australia, at: http://www.waterwatchadelaide.net.au/index.php?page=sampling-techniques
Teacher Note. Refer to chemical testing of Town water (Module 1) for further information.
Activity
Collect a Sample for Macroinvertebrate Analysis:
Method
1. At the collection site, students use the aquatic macroinvertebrate scoop net on a handle.
2. Take 10 minutes for the exercise and make several sweeps in the water body ensuring a wider representation of habitats is sampled.
· Collecting at the edge of a water body, near stones, logs, and vegetation, beat and scrape your net against the base of the aquatic plants.
· Collecting in running water, use kick sampling as follows: select an area within the water body that is shallow enough to stand in, about knee deep. Face downstream, submerge the net so it is in front of your feet on the floor of the riverbed, and position the mouth of the net so it's facing upstream. Shuffle, and kick the ground so the sediment, rocks etc are disturbed. Slowly walk backwards for five metres, continuing to kick and shuffle the ground.
· Collecting in slow moving water, use sweep sampling as follows:
(i) sweep the net across the surface and drag it through the water in a figure of eight motion.
(ii) empty the contents of the net, each time, into the 3L lidded container containing about 2L of stream water.
(iii) agitate the net gently for 30 seconds to remove animals.
(iv) check all organisms are removed from the net.
(v) return the container to the school laboratory and maintain the samples at 4oC for analysis of the macroinvertebrate pollution index in the following class.
Collecting methods are adapted from: Waterwatch, South Australia, at: http://www.waterwatchadelaide.net.au/index.php?page=sampling-techniques
Activity
Recording Macroinvertebrates in Inland Water:
Students understand that the greater number of different invertebrates they find (biodiversity), and the more sensitive they are (on the pollution index), the higher the water quality must be.
PREPARATION
· Bring the macroinvertebrate collection to room temperature.
· Download Magnifier, from the App store to student i-Pad.
· Print off WORKSHEET 5 - Macroinvertebrate Survey Sheet (TOOLBOX)
· Download and print off Aquatic Macroinvertebrate Identification Key https://www.uwa.edu.au/study/-/media/Faculties/Science/Docs/Aquatic-macroinvertebrate-Identification-key2.pdf
MATERIALS
· 2 white sorting trays
· 4 white ice cube trays
· plastic spoons to sort macroinvertebrates
· hand lens or magnifying glass or dissecting microscopes
· iPads with the Application ‘Magnifier’.
METHOD
1. Empty the stream water into 2 white collecting trays. It is important that the macroinvertebrates can be seen easily in the trays. If there is a lot of debris, use several trays.
2. Isolate each organism, if possible, using the spoon and place it in about a few drops of pond water in each compartment of the ice-block tray.
3. Samples may be examined using a dissecting microscopes (x4), or hand lens, or photographed using student i-Pad containing App Magnifier.
4. Students identify each macroinvertebrate, using the Aquatic Macroinvertebrate Identification Key
5. Enter data (ID of invertebrate and numbers counted) into WORKSHEET 5 - Macroinvertebrate Survey Sheet in the appropriate box (under TAXA RICHNESS).
6. Combine all data into a Class Macroinvertebrate Survey Sheet.
Activity
How to Calculate a Signal Score:
SIGNAL (or, Stream Invertebrate, Grade Number – Average Level) SCORE is a measure of the number of macroinvertebrates found, and their degree of sensitivity to pollution. Adding up their sensitivity scores indicates the quality of the water animals are living in.
The Sample Macroinvertebrate Survey Sheet (TOOLBOX) will help students to understand how a Signal Score is calculated.
From the Survey Sheet,
· have students note the following invertebrates were found: Freshwater shrimp, Whirligig beetle, Isopod, Damselfly nymph, Water boatman, Backswimmer, Caddisfly larva and Yabby.
· the Total of different macro invertebrates is 8, providing a TAXA RICHNESS of 8.
· SCORE is entered for each animal’s Sensitivity to Pollution number (ie. 8 for Caddis fly larva, 3 for Damselfly nymph, etc.
· if 2 Damselfly nymphs were found, SCORE will be 6.
· total the SCORES to find a POLLUTION RATING - in the example, it is 27.
· the SIGNAL SCORE is calculated by dividing the POLLUTION RATING by the TAXA RICHNESS.
in the example, 27 divided by 8 = 3.3, giving a SIGNAL SCORE of 3.3, indicating moderate pollution.
Activity
Calculating a Pollution Index for Inland Water:
METHOD
1. Using the Class Macroinvertebrate Survey Sheet (from Activity 8), students total the invertebrates and their SCORES (as in the sample above).
2. Calculate a SIGNAL SCORE from the data.
3. Using the SIGNAL SCORE, refer to the Pollution Rating Table, for a level of pollution in the waterway investigated.
4. Record the results.
5. Return the macroinvertebrates to the water body if possible; they provide food for other organisms.
Activity
Write the Field Report, Using All Data :
· Discuss what management strategies could be used at a water body to maintain health or to improve health.
· Write ideas on a ‘sticky’ note and stick onto a WordWall
· Suggestions might include (i) restrict numbers of people using the water body (ii) ban fires (iii) fence the area (iv) improve signage (v) install rubbish bins (vi) corral feral animals and (vii) manage septic tanks.
· Collate all ideas
· Discuss who should receive it.
Activity
Construct a Food Web for the Inland Water Investigated?
Using WORKSHEET 6 - Diets of common aquatic species (TOOLBOX), construct a food chain for your inland water studied.
Glossary
Active transport – specialised cells in membranes (gills, kidney, alimentary tract) that use energy to secrete and absorb ions such as sodium across the membrane.
Alkali – chemical compound that neutralises an acid.
Acid – a molecule or compound that can donate a proton or accept an electron pair in reactions.
Base – A substance capable of accepting or neutralizing hydrogen ions; reacting with an acid to form a salt and water.
Hydroxyl Ion – the ion OH-, denoting a water molecule that has lost a proton (H+).
Ions – atoms or molecules with a net electric charge due to the loss or gain of one or more electrons.
Neutralization – a chemical reaction in which an acid and a base interact with the formation of a salt; with strong acids and bases the essential reaction is the combination of hydrogen ions with hydroxyl ions to form water.
Permeability – is a porous material’s ability to pass water through its pores.
Porosity – is the amount of water that a material can hold in the spaces between its pores
pH – notation expressing the acidity or alkalinity of a solution on a logarithmic scale
pH scale – a scale from 0 to 14 reflecting the concentration of hydrogen ions in solution; the lower numbers denote acidic conditions, and the upper numbers denote basic, or alkaline, conditions.
Reference
1. Timms, B., Geomorphology of pit gnammas in southwest Australia. Journal of the Royal Society 96, 7-16 (2013).
2. Gambino, I., Bagordo, F., Grassi, T., Panico, A., De Donno, A., in International Journal of Environmental Research and Public Health. (2022), vol. 19, pp. 5283.
3. Chessman, B. C., New sensitivity grades for Australian River Macroinvertebrates. Marine & Freshwater Research 54, 95-103 (2003).