Module 1
Where is Earth’s Water
Where is Earth’s Water?
Water is our most valuable renewable resource. It is necessary for all forms of life, particularly humans, whose needs encompass domestic use, fishing, irrigation for growing crops, manufacturing, and power. Many industries have been built next to large sources of water, such as rivers or ocean. Rivers are dammed to store the energy in their flow as electric power, and most agriculturalists construct dams to store rainfall. An understanding of the cycling of this precious resource and how it underpins the plant and animal life on Earth is the basis of this module.
Most water (96.5%) is in the oceans as salt (or saline) water.
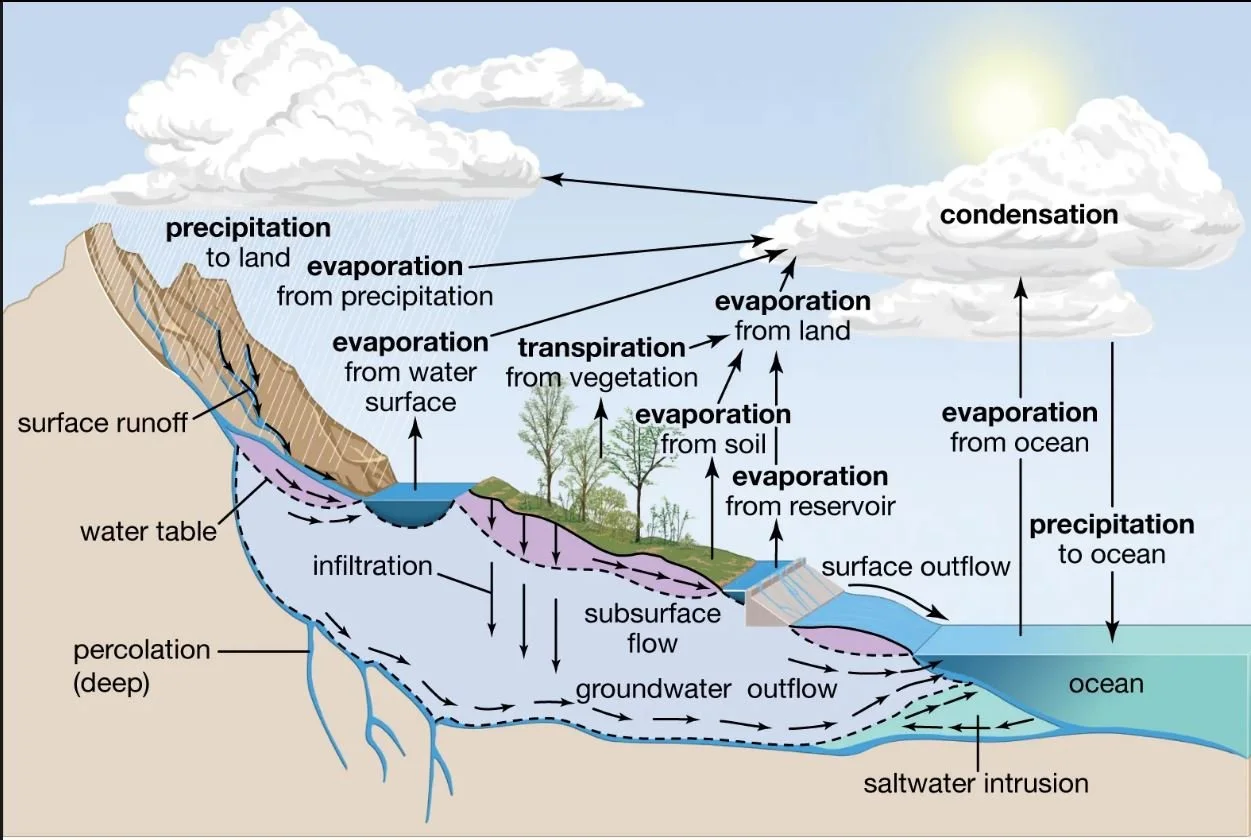
• Along the equatorial belt, heat from the sun evaporates the water, carrying it upwards as water vapour both north and south of the equator by warm and cool air currents.
• As the water vapour cools, it precipitates as fresh water, in the form of rain, hail, sleet, or snow.
• Some of the water soaks into the ground, leaving the rest to flow over land into streams, lakes, and into the ocean as runoff.
• This cycle, which has no beginning or ending, is known as the water cycle.
Nearly 70% of freshwater is contained in the glaciers and icecaps, and only 30%, mainly as rainfall, sinks into the soil. Mortlock River, tributary of the Avon R.
• Water percolates underground through rock fractures, or cracks, and unconsolidated materials like gravel, sand, or silt, until it reaches a confining layer – such as solid rock. This is called groundwater. The underground level where the spaces, fractures, and voids in the rock become completely saturated with water is called the Water Table.
For an overview of how water cycles through the upper layers of Earth’s surface, visit
https://www.usgs.gov/special-topics/water-science-school/science/groundwater-flow-and-water-cycle

From: https://en.wikipedia.org/wiki/Water_distribution_on_Earth#/media/File:Earth's_water_distribution.svg
Activity
Demonstrate the Proportion of Earth’s Water that is Fresh:
This simple group exercise demonstrates the proportion of Earth’s water that is fresh and available for humans to use.
Materials
· 10L bucket
· 300ml beakers (5)
· 100ml measuring cylinder
· 5ml pipette
· 1ml pipette
Method
1. Fill the 10L bucket to the 10L mark
2. From the 10L, remove 300ml to beaker (1). This represents the volume of fresh water on the planet. There remains 9.7L in the bucket, representing the volume of water in the oceans.
3. From beaker (1), using the measuring cylinder and the pipette, remove 204 ml into beaker (2). This represents the volume of water in icecaps and glaciers.
4. From beaker (1), using the measuring cylinder, remove 90ml into beaker (3). This represents the volume of groundwater.
5. From beaker (1), using 5ml pipette, pipette 4.5 ml into beaker (4). This represents permafrost (underground ice).
6. From beaker (1), pipette 1.5ml into beaker (5).This represents available surface fresh water.
7. A careful pipetting of 1.33ml from beaker (5) into a small test-tube represents the volume of surface water used for agriculture (horticulture and pasture) in the southwest of WA (see link below).
8. The volume, 0.17ml, remaining in beaker (5) represents the volume of fresh water available for other human uses.
9. Write up this activity with students presenting their data in tabular format, identifying the nature of each water source and expressing all volumes as percentages of Earth’s total water of 10L (i.e. 0.0017% is water for human use).
10. Students may research how humans use the tiny fraction of available surface fresh water remaining after agricultural usage.
Discuss
why it is important to save fresh water.
· How would students do this?
· Do they know what happens to fresh water that falls as rain? Where does it go?
· Comparing the volume 0.17ml, representing fresh water available for humans, with the 9,700ml (9.7L) remaining in the bucket as ocean water, what might humans do to increase the amount of fresh water for humans?
Southwest water usage taken from: https://library.dpird.wa.gov.au/cgi/viewcontent.cgi?article=1288&context=rmtr#:~:text=It%20is%20estimated%20that%20520,GL%20in%20south%2Dwestern%20regions
Water Cycle and Energy?
The water cycle is driven by energy from the Sun through the processes of evaporation, condensation, precipitation, and transpiration.
The sun's energy drives evaporation along the equatorial belt by heating water, thereby increasing its kinetic energy.
The heat evaporates about 2.5% of salt water, transporting it upwards as water vapour.
When water vapor in the air cools, the stored latent heat is released, and contributes to warming the atmosphere. This process is crucial for distributing both heat and water around the globe. The resulting freshwater falls as rain (precipitation).
Freshwater either freezes as hail, sleet, or snow, compacting into glaciers and icecaps (68.7%), or penetrates Earth’s surface to form groundwater (30.1%).
The remaining 1.2% is surface freshwater, divided up into ground ice and permafrost (69%) and in lakes (20.9%).
The remaining 10% is found in rivers and swamps (3%), soil moisture (3.8%), atmospheric water vapour (3%), and living things (0.26%).
The small contribution from living things includes transpiration during photosynthesis in plants, during which water vapour is passed out through stomates in leaves (see Year 7, Photosynthesis).
Thus, energy is not created or destroyed; it simply moves through the different states.
The Water Cycle
Activity
Understand the Water Cycle:
Aim
Understand that water moves throughout Earth’s seas, atmosphere and ground surfaces, with its cycling energised by the Sun.
Method
1. Draw a diagram, indicating where Earth’s water is found.
2. Annotate your diagram with each of the processes underlined above.
3. Use what you know about evaporation to explain your observations.
4. Using the information provided in Background, and calculations in the previous Activity, have students represent all the proportions of Earth’s water in a Water Cycle, adding their calculations to the diagram.

From: https://www.metlink.org/resource/the-changing-water-cycle/
Understanding Aquifers
An aquifer is basically a storage container for groundwater that is made up of different sediments. These various sediments can store different amounts of groundwater within the aquifer. The amount of water that it can hold is dependent on the porosity and the permeability of the sediment.
· Porosity is the amount of water that a material can hold in the spaces between its pores (or holes)
· Permeability is the material’s ability to pass water through these pores.
Therefore, an aquifer that has high permeability, like sandstone, will be able to hold more water, than materials that have a lower porosity and permeability, like gravel or rock.
Aquifers represent a tiny fraction (0.0075%) of Earth’s freshwater available for about 50% of humans who rely on them for irrigation of crops and market gardens.
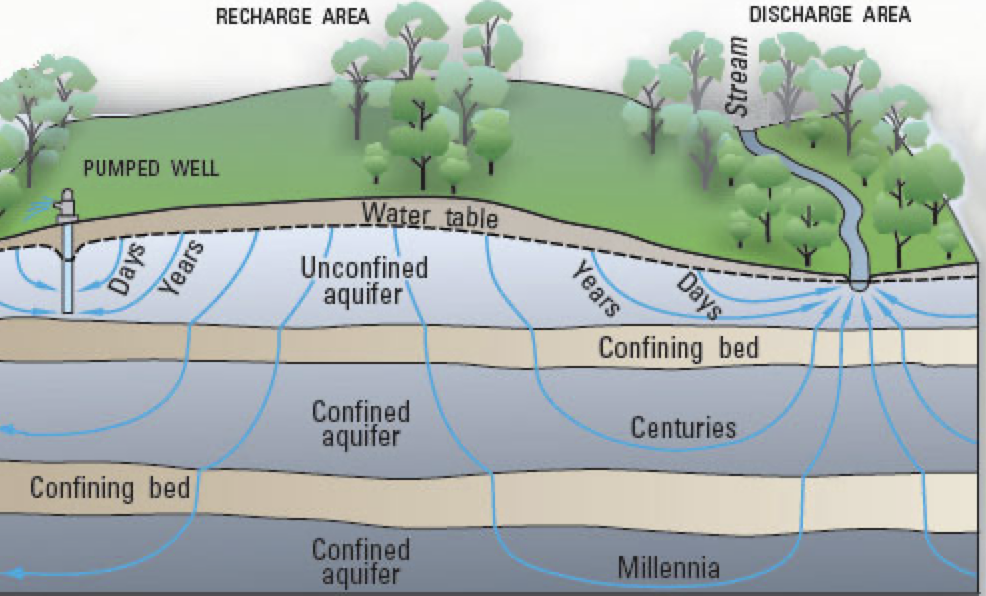
There are 2 types of aquifers:
1. unconfined aquifers discharge groundwater at the surface into springs, streams, and seeps (or wetlands), and are recharged from the surface by rainfall. Extraction is usually through a well drilled into the aquifer. If the Water Table falls through too much water extraction, or too little rainfall, a shallow well may go dry. How aquifers are recharged, visit https://www.usgs.gov/media/files/natural-water-cycle-pdf
2. confined aquifers are deeper, and dependent on the permeability of the surrounding layers. A deep confined aquifer has the water layer confined mostly between impermeable rock. Water penetrates more slowly into deep aquifers, and may take a long time to accumulate; water from these aquifers is ancient water. In the Yarragadee aquifer, for example, lying under the old rocks of the south-west corner of Western Australia, the water is understood to be about 40,000 years old.
3. Artesian wells. Extracting water from a confined aquifer, requires a deep well, drilled through the rock. These are called artesian wells. The water is usually under great pressure, and hot, because it comes from deep within the Earth’s crust. The world's largest confined aquifer is the Great Artesian Basin in Australia; it covers 1.7 million square kilometres, equivalent to about a quarter of the entire country.
From: https://d9-wret.s3.us-west-2.amazonaws.com/assets/palladium/production/s3fs-public/thumbnails/image/wss-cycle-groundwater-flow-diagram.jpg
Activity
Model an Aquifer:
This activity helps students to understand the properties of aquifers.
Aim
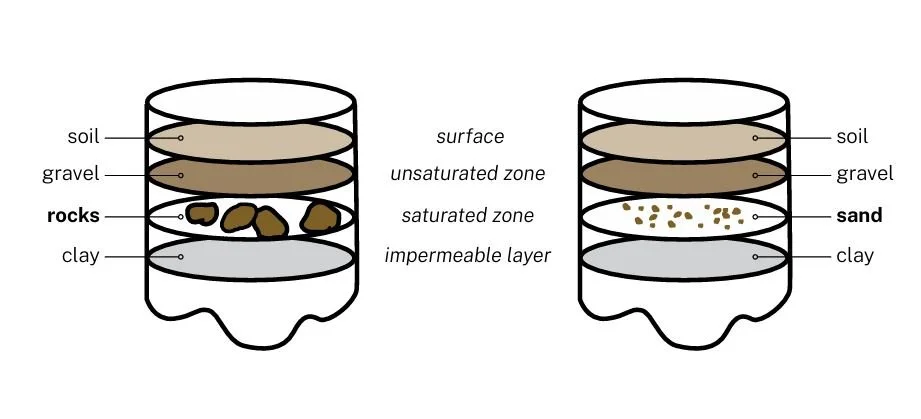
Students use both mediums, sand and gravel, to build models of an aquifer. They will compare the height of the ‘Water Table’ in both mediums,
and predict (i) - gravel will hold more water than sand, or (ii) sand will hold more water than gravel
Materials
Students work in pairs, with each pair equipped with
· 2 x 2-litre plastic Soda bottles
· 1 250ml measuring cup
· 2 cup soil
· 2 cup pea gravel
· 1 cup 2cm rocks (‘cracked’ gravel or blue metal)
· 1 cup sand
· water
· modelling clay, or plasticine liquid food colouring labels, scissors, ruler, pin
Method
1. Explain each layer to the students using the definitions given in the background information section.
2. Using the pin, make many holes in the bottom of a cardboard cup. This cup will later be filled with water and used to simulate equal amounts of ‘rain’ over the recharge area.
3. Cut the top off the 2L soda bottle and remove the base.
4. Flatten modelling clay and place it in the bottom of each soda bottle (leaving 5 inches from the bottom).
5. Make sure that you use the same amount of clay for each container. The clay represents the impermeable layer that stops water from continuing to flow deeper under the surface.
6. Pour 1 cup of rocks into one soda bottle and pour 1 cup of sand into the other soda bottle, to form the bottom layer.
7. Pour 1 cup of gravel on top of the rocks, and on top of the sand.
8. Pour 1 cup of soil on top of the gravel in each container.
9. Have students label different areas of the aquifer as: impermeable layer, saturated zone, unsaturated zone, and surface.
10. Pour a measured amount of water (example: 30 ml) into each cup with holes and create rain over the topsoil layer of each bottle. Have students notice the rise in the water table with ‘rain’.
11. Students measure the height of the water table, from the bottom of the soda bottle to the top of the water table and record the results for both containers.
Conclusions
· Since equal amounts of sediment and water were added in the experiment, then the only variable is the type of sediment added to the different containers.
· This means that the height of the water table is dependent on the type of sediment in each container.
· The container with the shortest water table height contains sediment that is capable of holding more water.
· This sediment takes up less space and must have the higher porosity or permeability than the container with the other type of sediment.
· Discuss the results of the experiment and the validity of the hypothesis.
Discussion
· Ask students to explain how porosity and permeability affect the amount of water that can be stored in an aquifer.
· Encourage the students to brainstorm further experiments that they can conduct to determine if porosity or permeability is more influential in groundwater storage.
· They may choose different types of sediment to fill the bottom layer of the containers, and have the class predict which sediment holds the more water.
· Students may choose to create another experiment in order to predict where the pollution will go when it is added to the topsoil layer of each container and rain falls down from the sky.
· This can be demonstrated by placing a drop of food colouring, symbolizing pollution in the surface layer, and then pour water to simulate rain.
· Discuss the importance of groundwater and how people use it.
Water in the Town
A town’s water supply is usually sourced from surface water or from bores into groundwater, or both. Groundwater is often cheaper, more convenient, and less vulnerable to pollution than is surface water, such as rivers, lakes, weirs, and dams, and is commonly used for public water supplies.
How is groundwater polluted?
The nature of the pollutants in groundwater and surface water depends on how close the water is to possible pollutants. These may be:
· residential area that has poor sanitation systems and improper sewage disposal, and poor wastewater treatment
· landfill areas (rubbish dumps) that have improper landfill practices
· industrial area with leakage from pipes, and other industrial releases
· agricultural areas where excessive use of pesticides, herbicides and fertilizers, are used
· fossil fuel power plants emitting air pollution
Two activities that can affect the quality of groundwater are:
· over pumping of groundwater, which increases the concentration of pollutants
· deforestation, resulting in higher-than-average concentrations of salt in the soil (salination), which percolates into the groundwater.
Salinity
Most think of salinity as the saltiness (sodium chloride or common salt) in seawater, the concentration of which is 33 to 37g sodium salt/L. But salinity is a measure of all dissolved salts in water, and referred to as Total Dissolved Salts, notated as TDS.
After water falls to the ground as rain, it dissolves the minerals in the rock and soil that it passes over, the most common being calcium and magnesium, as well as sodium; all of which remain in the water at varying levels of concentration
Salts are molecules consisting of a cation (a positively charged ion), such as sodium, calcium, or magnesium, bonded with an anion (or negatively charged ion), such as chloride, sulphate, fluoride, or phosphate. When dissolved in water, the molecules dissociate into their positively and negatively charged ions.
These dissolved salts, called solutes, are thus measurable as electrical conductivity.
Acidity
Acidity is a measure of the concentration of hydrogen ions dissolved in water. Water molecules (H2O) are in constant motion. When two molecules collide, they may split apart (dissociate) and form hydrogen ions (H+) and hydroxyl ions (OH-).
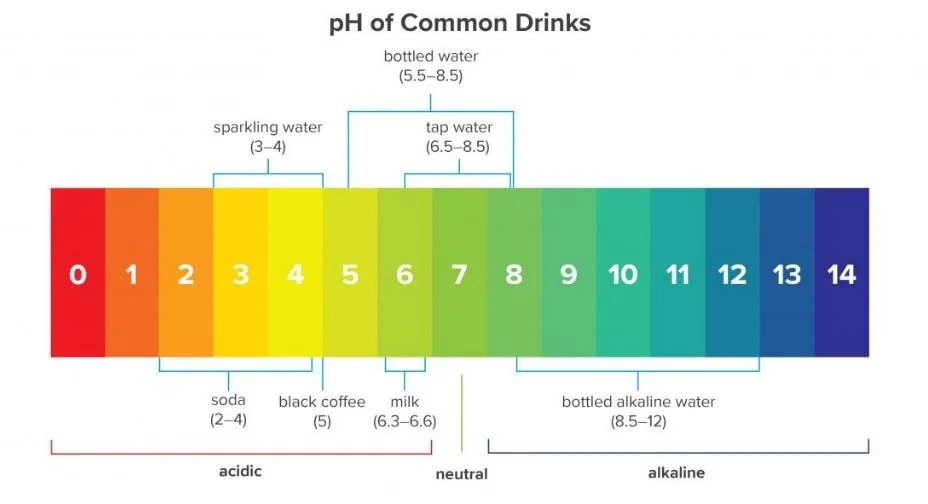
The concentration of hydrogen ions in a solution is denoted as pH, with pH = - log (H+).
pH is generally reported on a scale of 1 to 14. A pH of seven is neutral; values less than seven are acid and values greater than seven are alkaline (or basic).
pH is a logarithmic scale, which means that every 1 unit change on the pH scale corresponds to a 10-fold change in hydrogen ion concentration. For example, a solution with pH 4 is 10 times more acidic than a solution with a pH of 5; it has 10 times the concentration of H+ ions.
A solution with pH 3 is 100 times more acidic than a solution with a pH of 5. It has 100 times the concentration of H+ ions.
Nitrates and phosphates
Nitrates and phosphates are the oxidised forms of nitrogen and phosphorus and occur naturally in drinking water.
Nitrates are usually the result of the natural process of underground plant decay; they are highly soluble (dissolve in water) and move easily through soil, accumulating in groundwater that may be used as a drinking water supply.
High levels of nitrate in water can result from runoff or leakage from fertilized soil, wastewater, landfills, animal feedlots, septic systems, or urban drainage.
As phosphate is the principal product in agricultural fertiliser, the main source of excess in a rural town water supply is drainage from farmland fertilisers, runoff from manure, etc., sewage effluent (which contains dishwasher detergents, food and drink additives), and fossil fuel burning.
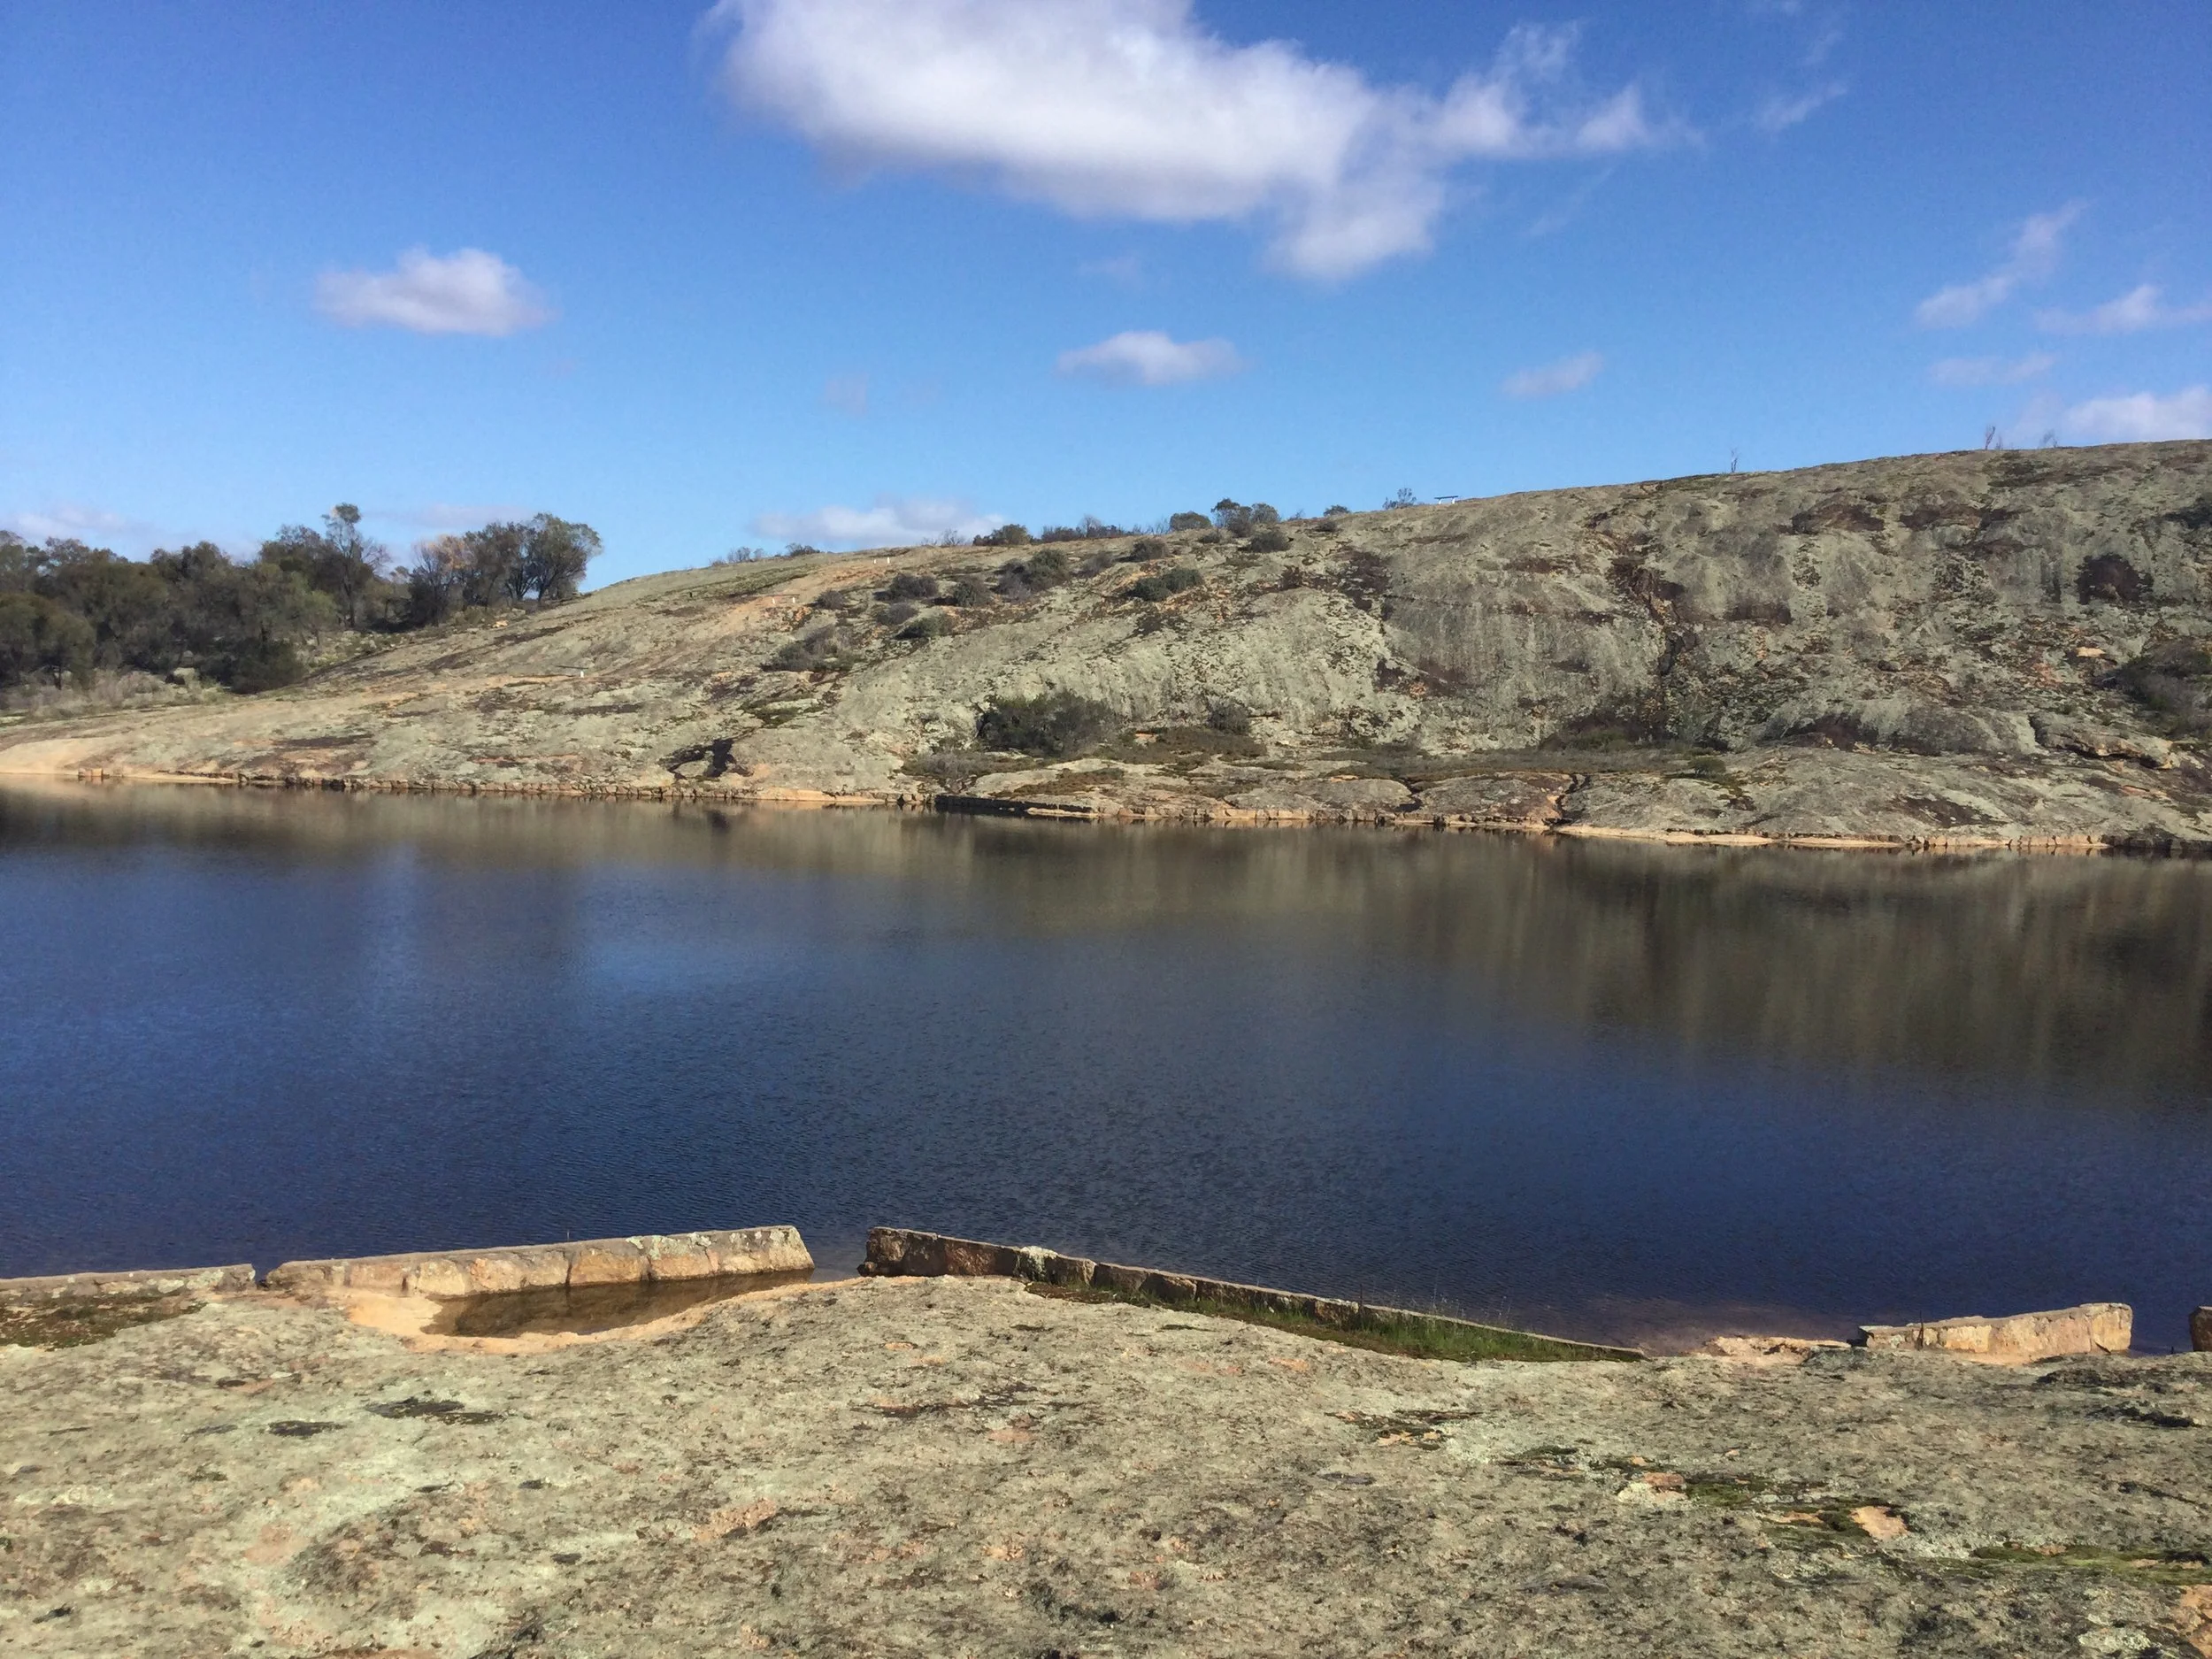
Toapin Weir, Quairading
Activity
Measure the Chemistry of Town Water:
Kits are available for schools that measure all parameters; pH, turbidity, salinity, temperature, nitrate, phosphate, dissolved oxygen, and E.coli. These can be obtained from:
Vendart Diagnostics
a. Earth Force Low-Cost Water testing Kit (SKU 5911) https://www.vendart.com.au/earth-force-low-cost-estuary-monitoring-kit/?srsltid=AfmBOoq1-zDSOM3jy-QjDHD_SoDym6MyyWLCbY0KRnbVbvCLYGKRpEWX
b. Earth Force Elementary Education Watershed Field Trip Kit (SKU 5906) https://www.vendart.com.au/earth-force-elementary-education-watershed-field-trip-kit/?srsltid=AfmBOooh61wsCNUsnpL939UCUnkUoIx33cWZeCIFBszJMED7NRQAC1B-
Watertest Systems (LM3-5886) https://www.watertestsystems.com.au/earth-force-low-cost-water-testing-kit
1. Measure salinity
Materials and Method
See Stockists for equipment (TOOLBOX) and methods of usage.
TDS may be measured with either of 2 devices:
1. Using a conductivity meter – a conductivity meter measures the electrical conductivity (EC), or the amount of electricity that can pass through water. This is proportional to the concentration of dissolved salts in the water, and reported as mS (microsiemens)/cm.
To convert EC to TDS: TDS (mg/L) = EC(mS/cm) X 0.6
2. A handheld refractometer – refractometers measure how much light bends, or refracts, when it passes through a liquid (called the refractive index). The more salts (and other material) dissolved in the water, the more resistance the light will meet and the more it will bend. This is because light travels at different velocities depending on the medium. The salinity of freshwater is less than 0.5 parts per thousand (or 0.5g/litre) and the salinity of saltwater is between 30 and 35 parts per thousand (ppm) (or 30-35g/L). This is a seventy-fold increase in concentration; the device may be more useful in saline systems.
Discussion
Is salinity in drinking water harmful?
Salinity is a very natural process; it helps make water taste ‘right’ by slightly raising the pH of the water.
· There is no common ‘yardstick’ for the optimum concentration of salinity, or acidity, in drinking water across Australia.
· Water in the range 80 to 100 mg TDS/litre, and a pH range of 6.8 to 8.5, are considered to be ideal, meaning the water is not too ‘hard’ and not too ‘soft’, with the right amount of dissolved minerals for optimal taste.
· TDS levels up to 500mg/L are present in some town supplies, and lower levels are advisable for some health conditions.
· There are 2 naturally occurring salts that can be harmful to human health in higher-than-normal concentrations; these are salts of arsenic and lead.
(i) Lead originates from the runoff from roads, and corrosion of old pipes, caused by too high concentrations of acid or alkali in the water.
(ii) Arsenic occurs naturally in soil and rock and is found in the drinking water across Australia. Its concentration, however, increases from the burning of fossil fuels and the use of arsenical fungicides, herbicides, and insecticides in agriculture.
2. Measure acidity
Materials and Method
Acidity may be measured using
1. a portable pH meter
2. Test strips, from
a. https://waterflowcontrol.com.au/blog/ph-of-water/
For humans, the pH range considered safe to drink is between 6.8 to 8.5. H+ concentrations in water supplies are considered ‘weak’ acids and, according to World Health Guidelines pose little threat to human health.
3. Measure turbidity
Turbidity is a measure of the cloudiness of water, generally caused by undissolved material suspended in water, such as particles of mud, sand, and microscopic organisms like algae.
Turbidity is measured in nephalometric units (NTU). These are optical units that measure the scattering of light.
Materials & Methods
There are several methods for measuring turbidity. See Stockists for equipment (TOOLBOX) and for methods of use for 1 and 2.
1. Using a turbidity tube
2. Using a Secchi disc, named after its founder, the Italian
astronomer, Angelo Secchi.
3. Using the naked eye.
A simple method to measure turbidity is to establish a value at which turbidity becomes visible to the naked eye.
(i) Students compare visually the sample to be tested alongside a sample of potable water, holding the 2 samples against a backdrop of white paper.
(ii) Students conclude with a scale of ‘yes’, ‘moderate’ or ‘no’.
(iii) Containers must be standardised, leading to discussion on the accuracy of the method, which also depends on the visual capabilities of the student.
Results
Potable drinking water should have a turbidity of less than one NTU, ideally 0.5NTU.
4. Measure nitrates and phosphates
Nitrates and phosphates are the oxidised forms of nitrogen and phosphorus and occur naturally in drinking water.
Materials and Methods
See instructions for use of TesTabs in the La Motte measuring kit for measuring nitrates and phosphates. https://www.southernbiological.com/lamotte-n-p-k-soil-test-kit/?srsltid=AfmBOoosKfBk0Er55fBJbloX_ohIlPPSw2YqyyQeGhQrIeISLIXRRF52
Results
For adults, the safe concentration of nitrate in drinking water should be less than 50ppm (or < 50mg/L).
The recommended safe levels of phosphate in drinking water should be less than 40ppm (<40mg/L).
Activity
Measure Salinity, Acidity, Turbidity, Temperature, Nitrate, Phosphate, E.Coli in the Town Water supply:
Materials
· Kits are available for schools that measure all parameters; pH, turbidity, salinity, temperature, nitrate, phosphate, dissolved oxygen, and E.coli. These can be obtained from:
Vendart Diagnostics
a. Earth Force Low-Cost Water testing Kit (SKU 5911) https://www.vendart.com.au/earth-force-low-cost-estuary-monitoring-kit/?srsltid=AfmBOoq1-zDSOM3jy-QjDHD_SoDym6MyyWLCbY0KRnbVbvCLYGKRpEWX
b. Earth Force Elementary Education Watershed Field Trip Kit (SKU 5906) https://www.vendart.com.au/earth-force-elementary-education-watershed-field-trip-kit/?srsltid=AfmBOooh61wsCNUsnpL939UCUnkUoIx33cWZeCIFBszJMED7NRQAC1B-
Watertest Systems (LM3-5886) https://www.watertestsystems.com.au/earth-force-low-cost-water-testing-kit
· test-tubes, test-tube racks.
· pipettes (5 and 10ml)
· disposable plastic gloves for students.
· Download WORKSHEET 1 – How to measure water parameters (TOOLBOX)
Method
All students must wear disposable gloves. This is essential for avoiding chemical contamination
1. Each student pair collects about 100 ml school drinking water (from the tap) in a clean beaker. Allow the tap to run for 5 seconds before collecting.
2. Using the La Motte water kit, follow the instructions on the kit, described in WORKSHEET 1
3. Help students to interpret the units used in each parameter. (See Useful Tips below).
4. Each student enters the result of each parameter tested, as given in the example, WORKSHEET 2 – Town water supply, example (TOOLBOX)
5. If using Hach test strips, (for pH, nitrates, and phosphates), these may be measured by dipping the strip into the water sample. Compare with colours printed on the bottle to find a reading. Record.
Master sheet. Enter all students’ results on the class screen (they will vary).
Have students calculate the class average for each parameter and enter into WORKSHEET 3 – Data record for all waters (TOOLBOX).
Useful tips for calculating concentrations (or parts per quantity)
Percentage
1g/100mL = 1%
Parts per thousand (ppt)
1g/1000mL = 1g/L (or 0.1%)
Parts per million (ppm)
1g/1,000,000mL = 1g/1000L (or mg/L) (or mg/Kg) (or 0.0001%)
Thus: mg/L or mg/Kg values = ppm
To convert percentage to ppt, multiply by 10; to convert to ppm, multiply by 10,000
Activity
Write up a Health Report of the Town’s Water Supply:
Using the data from the Master sheet, have students work collaboratively to construct a health report on their school water supply, using the following
Method
1. Identify the origin of the town water supply, (a bore into a groundwater aquifer, a dam, a weir, or a combination of both).
2. Have students research information from www.data.wa.gov.au at the following site: https://catalogue.data.wa.gov.au/dataset/public-drinking-water-source-areas
3. Write the aim of the exercise, introducing the parameters that were measured, with a brief account of how each may affect the town water supply.
4. What possible contaminants might enter our water supply? Where would they come from?
5. Using the Master sheet, report your results of all parameters tested, their units, and provide the normal ranges for water potability in WA.
6. What would happen if too much water was extracted from the aquifer, and how might it be recharged?
7. Students conclude from their data that their town water supply is within potable limits.
The Report is a valuable document. Students may wish to submit their Report to the local Shire office for their records.
Teacher Note - There are consequences for human health in drinking water from plastic containers. A recent study by the Clean Water Action Group found the presence of microplastics (damaging to the health of ecosystems) in 93% of bottled water. The average number of particles for every litre of water sold is 325. Microplastics are now found everywhere – marine and surface water bodies, wastewater, and groundwater; and now transported through the trophic food chain. (2)
Tap water may be a healthier source of drinking water than the now ubiquitous plastic water bottle.
Glossary
Active transport – specialised cells in membranes (gills, kidney, alimentary tract) that use energy to secrete and absorb ions such as sodium across the membrane.
Alkali - chemical compound that neutralises an acid.
Acid - a molecule or compound that can donate a proton or accept an electron pair in reactions.
Base - A substance capable of accepting or neutralizing hydrogen ions; reacting with an acid to form a salt and water.
Hydroxyl Ion - the ion OH-, denoting a water molecule that has lost a proton (H+).
Ions - atoms or molecules with a net electric charge due to the loss or gain of one or more electrons.
Neutralization - a chemical reaction in which an acid and a base interact with the formation of a salt; with strong acids and bases the essential reaction is the combination of hydrogen ions with hydroxyl ions to form water.
Permeability - is a porous material’s ability to pass water through its pores.
Porosity - is the amount of water that a material can hold in the spaces between its pores
pH - notation expressing the acidity or alkalinity of a solution on a logarithmic scale
pH scale - a scale from 0 to 14 reflecting the concentration of hydrogen ions in solution; the lower numbers denote acidic conditions, and the upper numbers denote basic, or alkaline, conditions