In the Classroom
Working with the Data
Activity
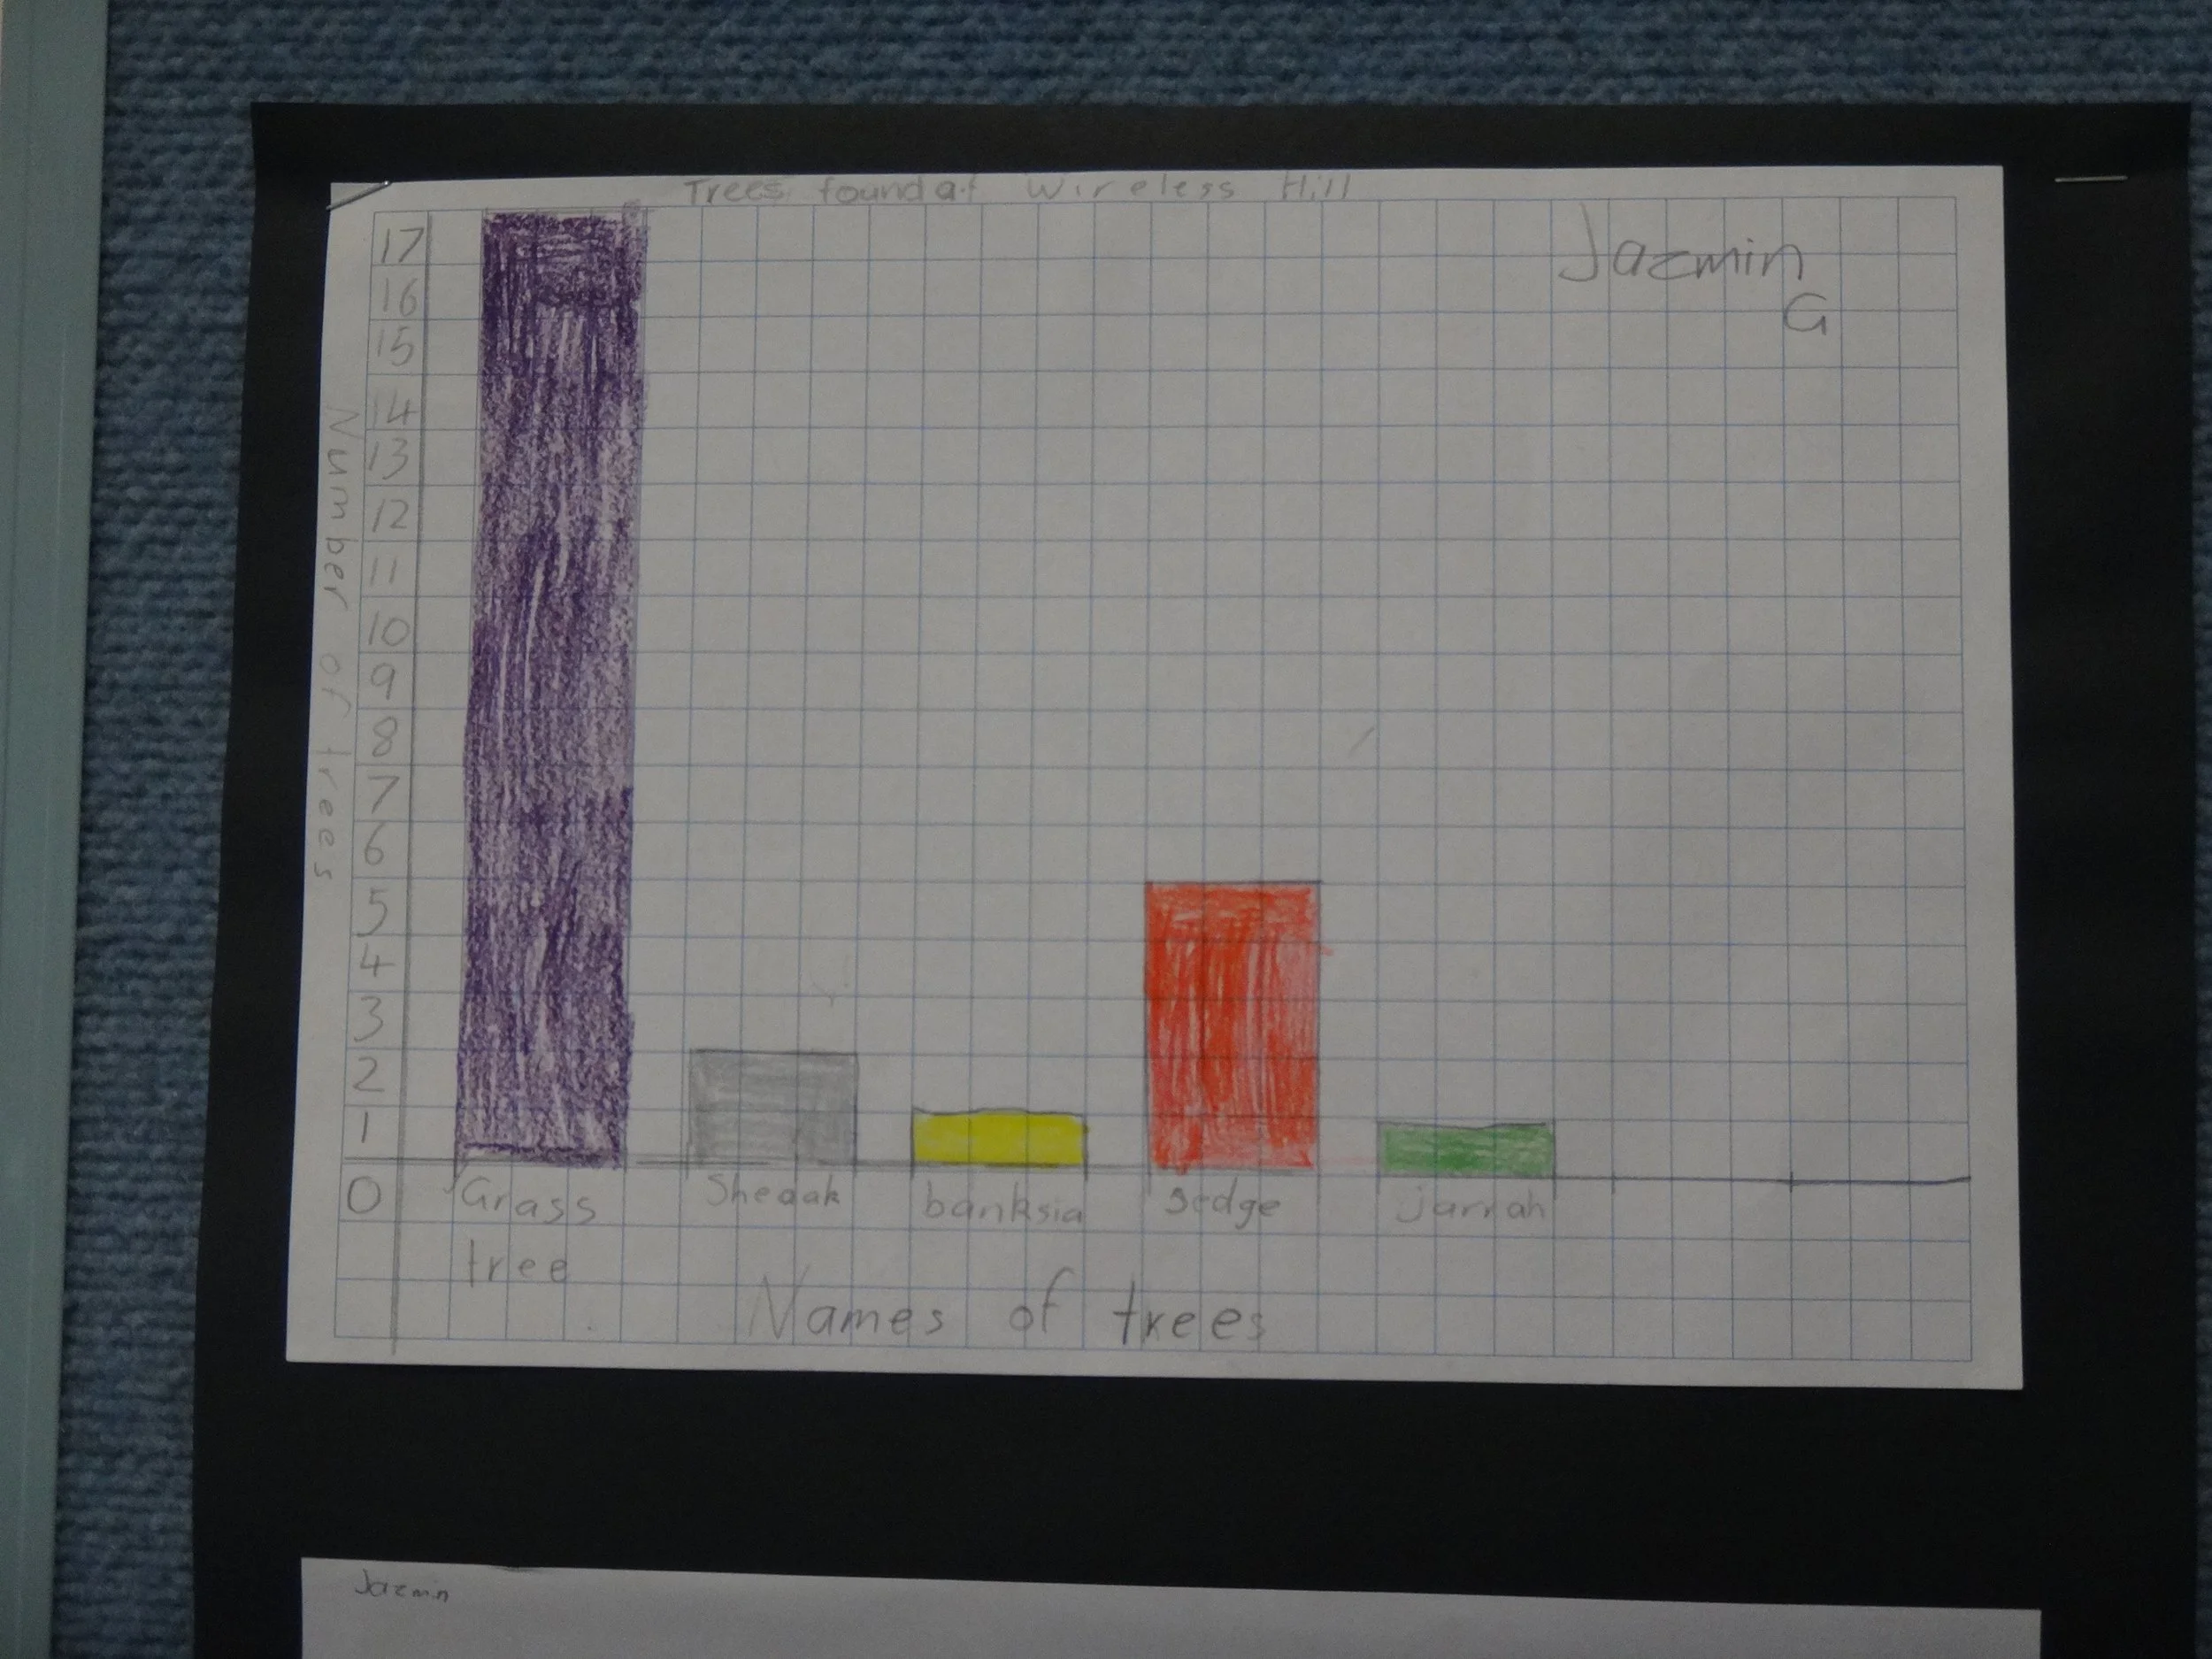
Graph trees:
Each student construct a column graph from their tree record.
EXPLAINING GRAPHS
• When plotting 2 variables (a tree type and its number), tree name is recorded along the horizontal axis (x), and the number of trees is recorded up the vertical axis (y). Why?
• The trees have a name; they are ‘fixed’ and are independent of the students’ counts. The independent variable is always plotted along the x-axis of the graph.
• The student’s data records the number of trees; it could vary, and it depends on a particular tree – it is the dependent variable, and always plotted up the vertical y-axis.
See: https://mathbench.umd.edu/modules/visualization_graph/page02.htm
MAKE A MASTER GRAPH
To record the actual number of trees in a site, a Master Table is required.
Tree counts will be different between students for the same site. Some trees may be difficult for students to identify; some students are overly enthusiastic (or did they lose concentration?)
Scientists also arrive at different numbers for the same experiment; usually an average is calculated, with an acceptable range. Student data, however, is best averaged, or finding a middle number, the median.
FIND THE MEDIAN
See: https://www.mathsisfun.com/median.html
An example of student counts may be:
40, 48, 26, 27, 29, 45 ,40, 36, 97, 30, 16, 22, 78, 31, 18, 109, 25, 106, 35, 11, 106, 98.
1. Rearrange the counts in ascending order
2. Rearrange the counts in ascending order 11, 16, 18, 22, 25, 26, 27, 29, 30, 31, 35, 36, 40, 40, 45, 48, 78, 97, 98, 106, 106, 109
3. Count inwards evenly from both sides and arrive at the middle number/s.
4. The median value here is halfway between 35 and 36 (35.5), and expressed as 36.
5. Enter the median counts for each tree species into a Master Table
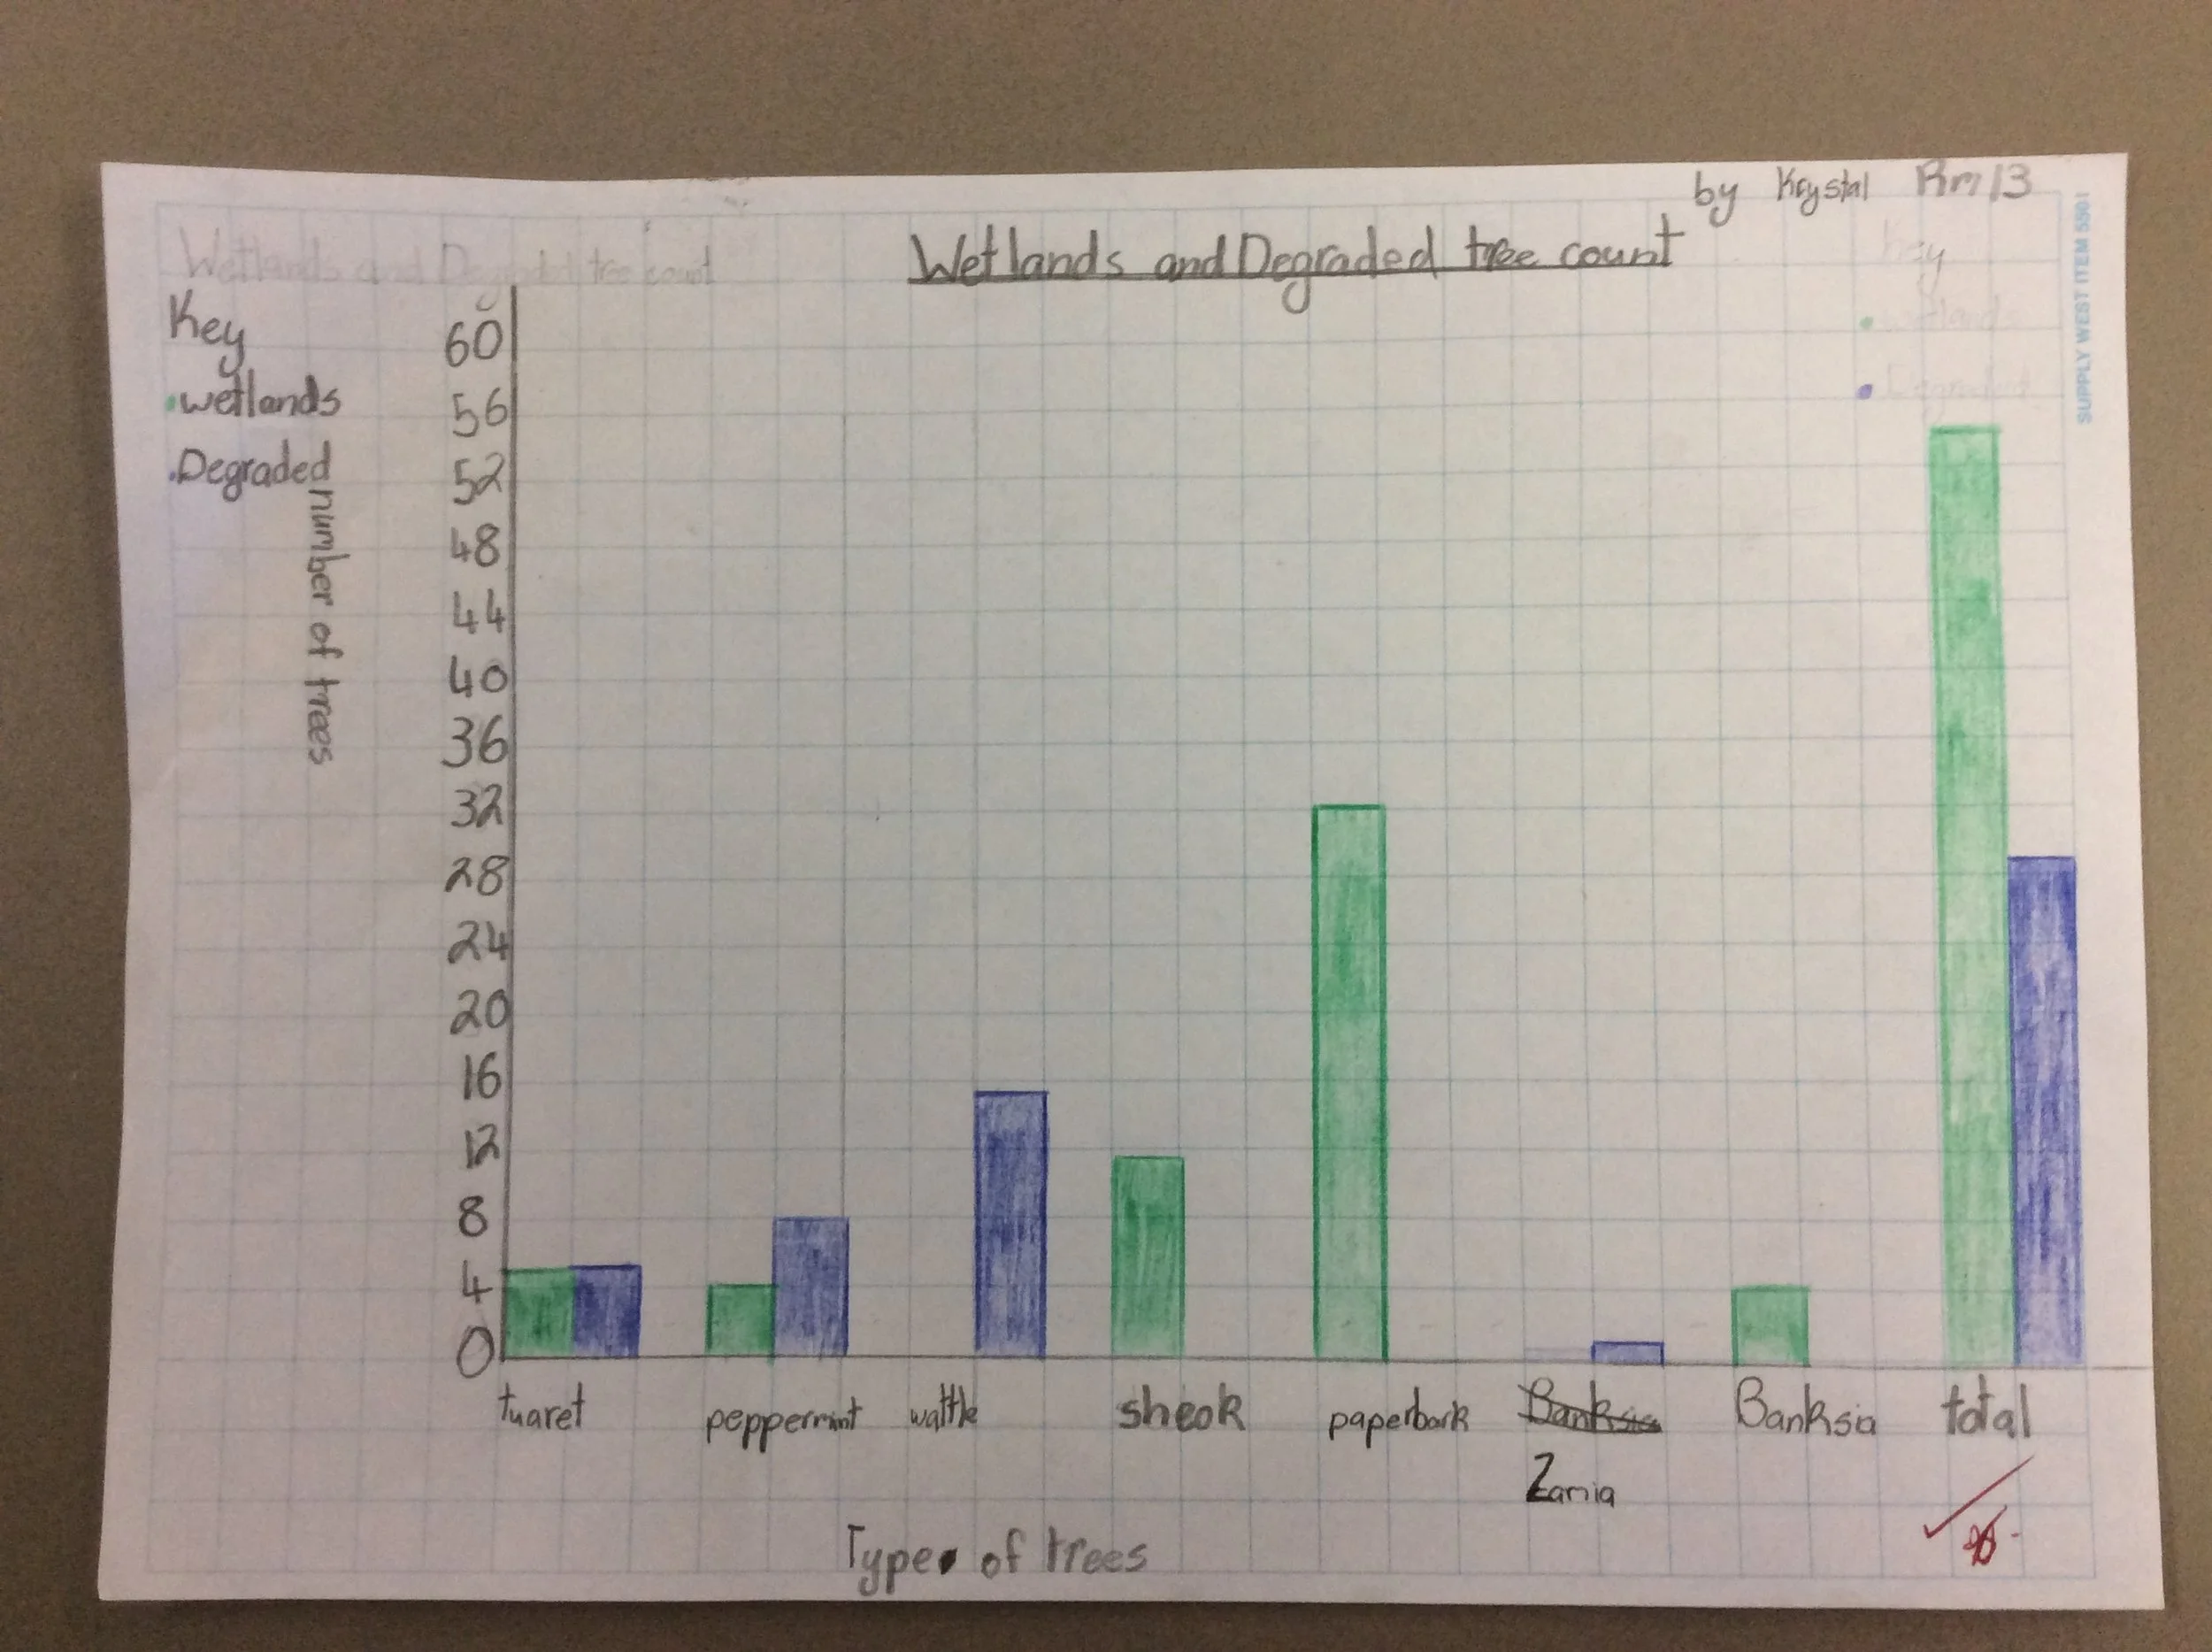
CONSTRUCT A CLASS GRAPH
Using the Master Table, students construct a Class Graph of trees counted at the 2 Sites. Display in the classroom.

Trees and animals at Bibra Lake. Photo: Tanya Miller
Trees at Bibra Lake, year 4. Coolbellup Community School
Trees in School Reserve, Adam Rd PS. Photo: Kerrilyn Bradshaw
Activity
Identify and Record Invertebrates:
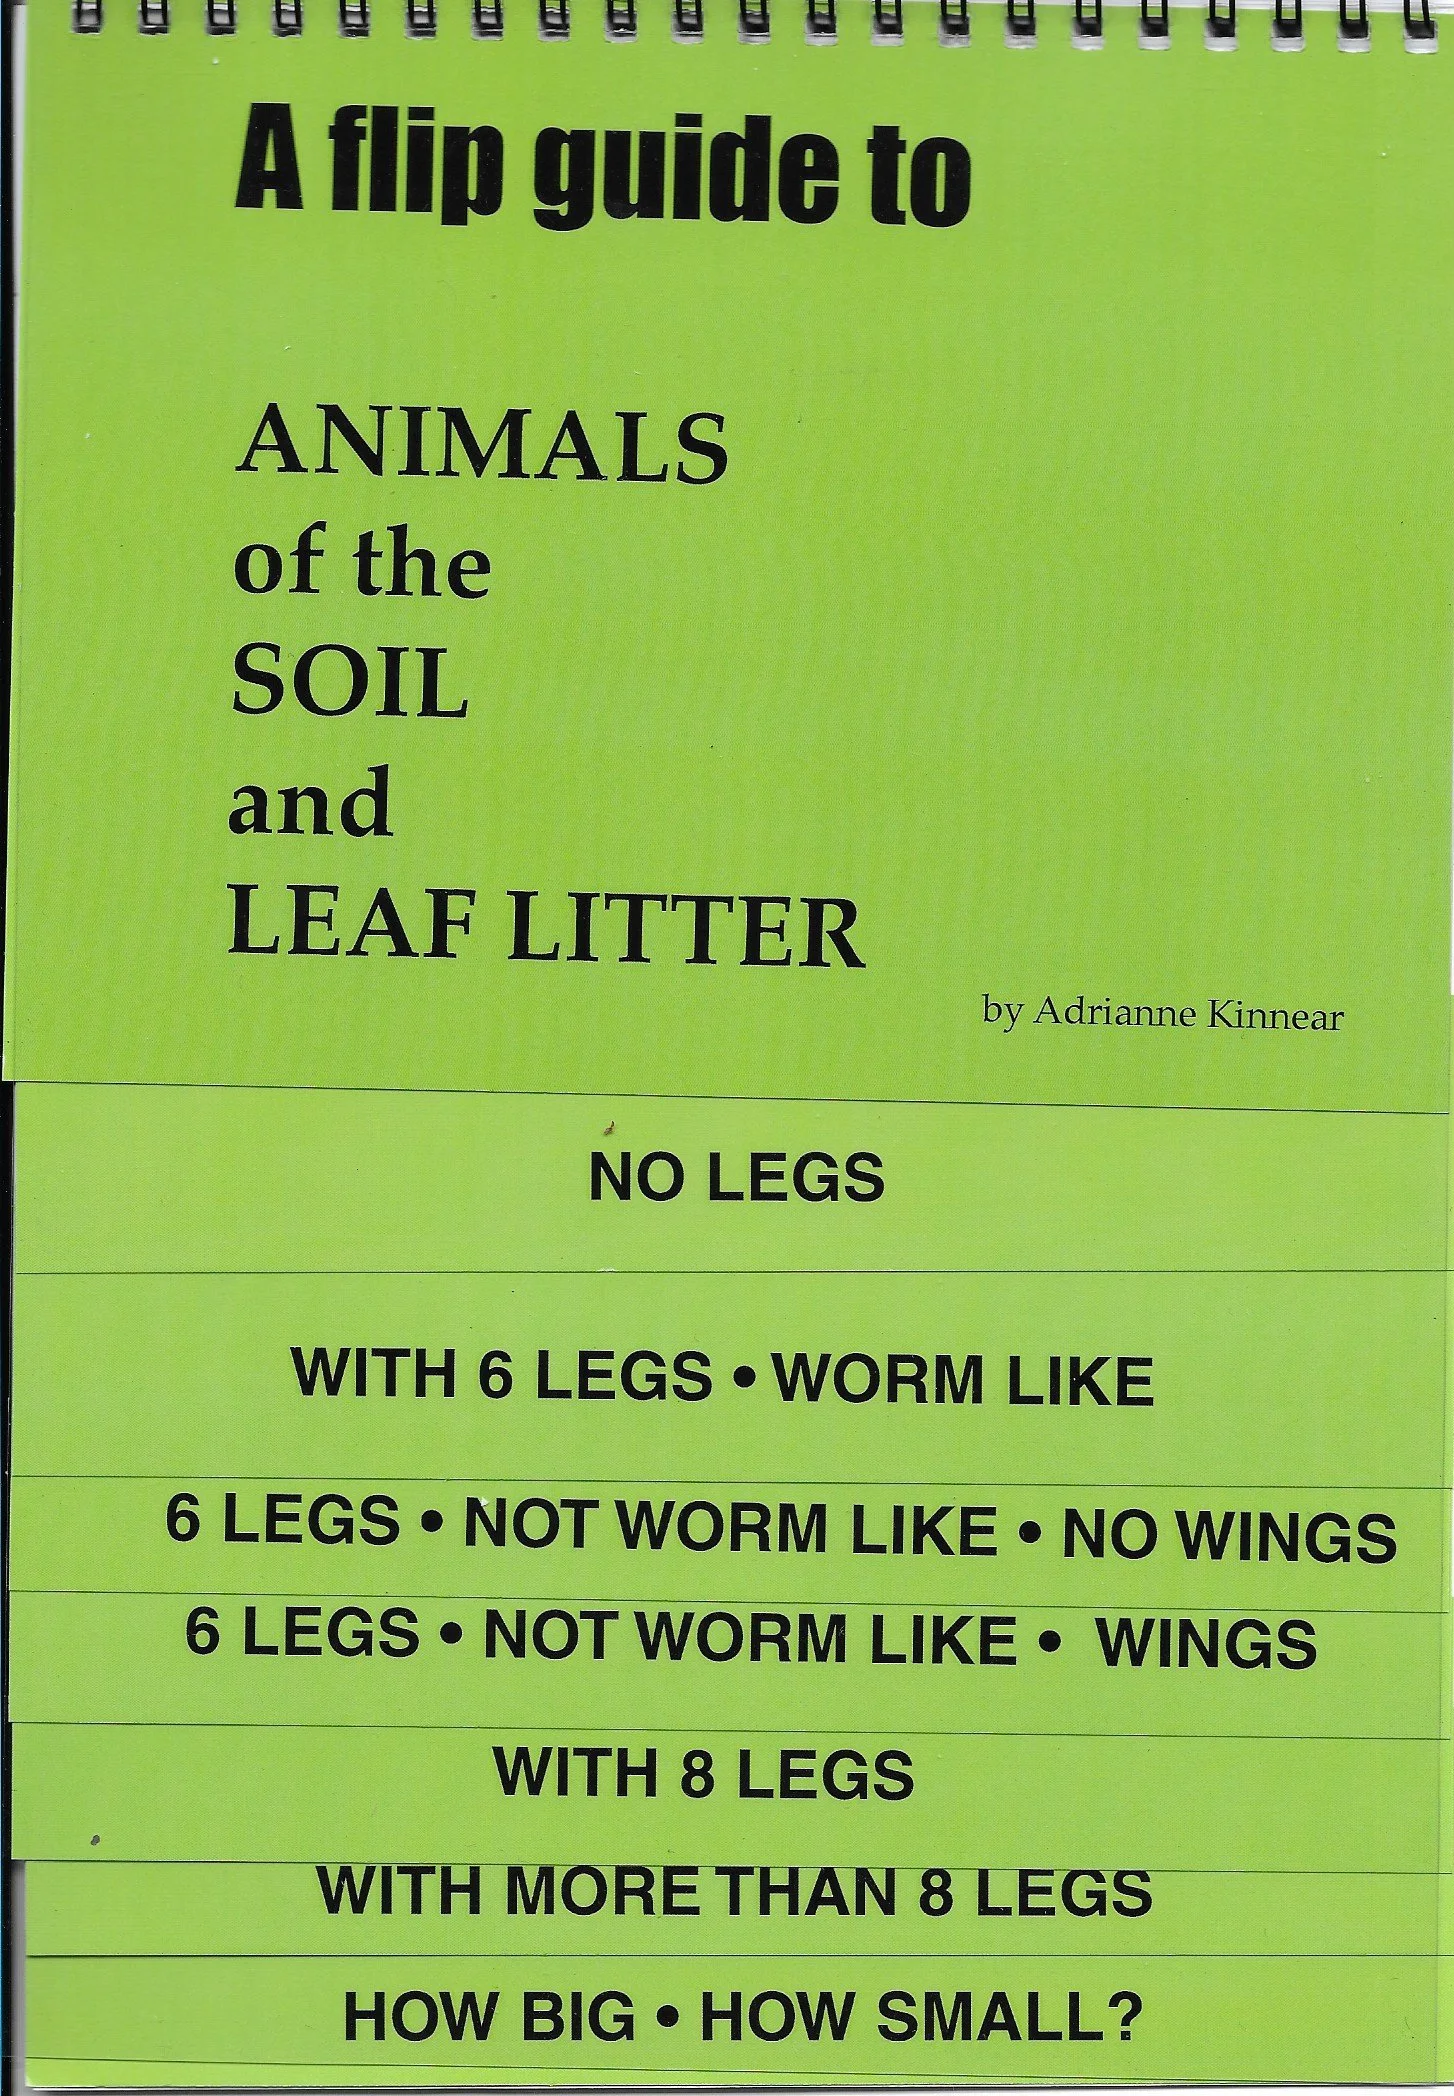
1. Using wooden probes to manipulate animals, students sort their invertebrates with the help of the Flip Guide key (TOOLBOX) based on absence, or presence and number of legs.
2. Further identification can be made with the help of the CSIRO website at www.ento.csiro.au/education/key/couplet_01.html
3. Count the number of invertebrates in each animal group (based on leg numbers, and further ID) and record in the WORKSHEET Working with animals in the pittrap (TOOLBOX).
4. Students may also use a dichotomous key, (What invertebrate is it? pp1-2, see TOOLBOX.)
Activity
Construct a Class Graph, using a Master Table:
1. Combine all student counts in a Table, as in the example. (Master Table- Year 4, QDHS)
2. Using the counts from the trapping sites, have students construct a column graph of the numbers of invertebrates in the Site they investigated, according to the Master Table. Display in the Classroom.
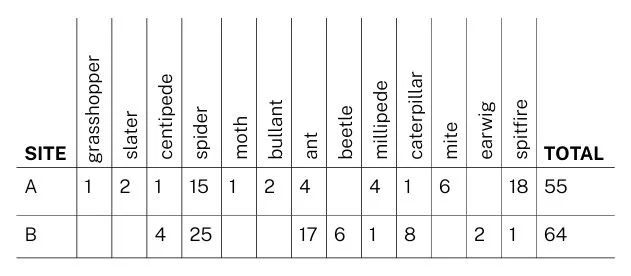
Invertebrate Master Table, Yr 4 QDHS