Extension
Telling the Difference
This Special Science Topic introduces the Mann-Whitney test, a non-parametric statistical test used to test whether two sample means are significantly equal or not.
Students compare their recorded data of natural and degraded land, or town and natural water, analysing the mean difference between animals counted, or chemical and physical qualities assessed.
How different do these means need to be before they can be sure that the difference is real, and not just chance variation?
Activity
Mann-Whitney Test:
In the example, the number of ants counted in pitfall traps is recorded in 2 Sites, each with 12 traps.
AIM
Is the number of ants significantly different between the 2 Sites?
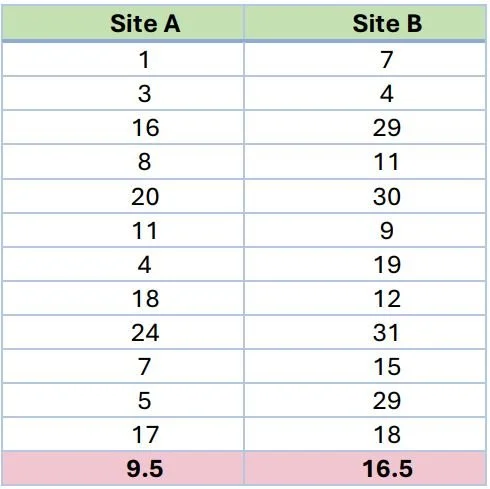
• In the example, the numbers of ants in each site vary; 1 to 24 in Site A, and 4 to 31 in Site B.
• Calculating an average, or median number for each Site, gives the median for Site A as 9.5 and 16.5 for Site B.
• It looks as if there is a real difference between the number of ants in the two sites. But is there?
If there is a real difference between the number of ants in the two Sites, we must be sure that something other than chance is operating.
METHOD
1. Estimate RANK ORDER We can decide this by looking at the extent to which the numbers of ants caught in each trap overlap between the two Sites.
• Ideally, we would expect all the low numbers to occur in one Site, and all the high numbers in the other – because that is the meaning of difference.
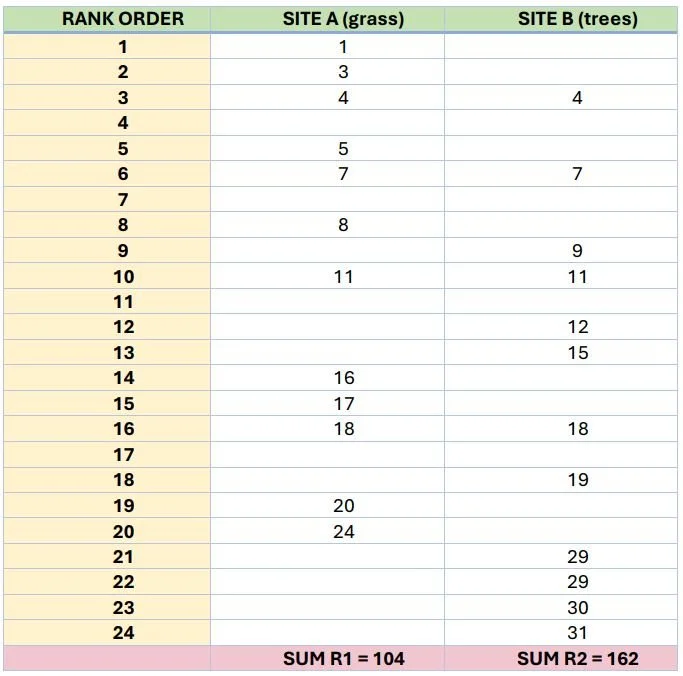
• We can test for this by listing all the individual numbers from the 24 traps in rank order.
The lowest number in our example is 1 and this gets a rank of 1. Equally, the highest number we have is 31 and that gets a rank of 24.
2. Sum the ranking numbers assigned to the trap numbers from the two Sites. Our figures will look like this
3. Estimate PROBABILITY If there is a real difference between the two sites, we would expect most of the low ranks to be in one site, with the high ranks in the other.
In our example, however, there is overlap, with some low ranks in Site B and some high ranks in Site A.
We assess the likelihood (or probability) of the overlap occurring by chance, by calculating two values, U1 and U2.
Calculating U1
U1 = N1 x N2 + (N1(N1 +1))/2 - R1
where N1 and N2 are the number of traps in each site and R1 is the sum of the ranks for Site 1.
In our example, U1 = 12 x 12 + (12(12+1))/2 - 104 = 118
Calculating U2
U2 = N1 x N2 + (N2(N2+1))/2 – R2
where N1 and N2 are the number of traps in each site and R2 is the sum of the ranks for Site 2.
In our example, U2 = 12 x 12 + (12(12+1))/2 – 162 = 60
4. Refer to the chart for Critical Values of the Mann-Whitney test.
We look up the smaller of these two values (in this case, 60) in the chart to decide if there is a real difference between the two Sites.
• Along the top we check the number of traps in Site 1 (12) and down the side we check the number of traps in Site 2 (in our case, also 12).
• From the table we can now read off a number of 37.
• This is the number we have to reach if the difference is meant to be real (significantly different) with a chance of 95% (or 27, if we want the probability to be 99%).
• In this case we didn’t make it, as our smallest R number was 60 .
CONCLUSION
Although the medians look different (9.5 vs 16.5), because of the overlap, this difference is most likely to have occurred by chance.
Making the calculation greatly strengthens our conclusion when we come to report on how accurate our data are.